 ISAAC WOOTEN

Column Five
The visual agency behind a generation of infographics. I built its 2013 site and the admin behind it on Rails and Angular, and led UI on Visage, its real-time data platform. The site, the admin and the brand world they implied.
Column Five turned numbers into stories. Founded in Orange County in 2009 by Ross Crooks, Josh Ritchie and Jason Lankow, it helped make the infographic a medium, for the NFL, Microsoft, DonorsChoose.org, McKesson, A&E and AARP among hundreds more, and wrote the book on it: Infographics: The Power of Visual Storytelling (Wiley, 2012). I joined in June 2013 as a senior software developer. I built the agency’s site on Rails and Angular, with an admin that let the studio publish its projects, case studies and clients itself, and led UI design and front end on Visage, its real-time data visualisation and reporting platform. What it taught me: when the work is the product, the site’s job is to get out of its way.
The brief
An agency that makes information beautiful has to make its own site the clearest thing it ships.
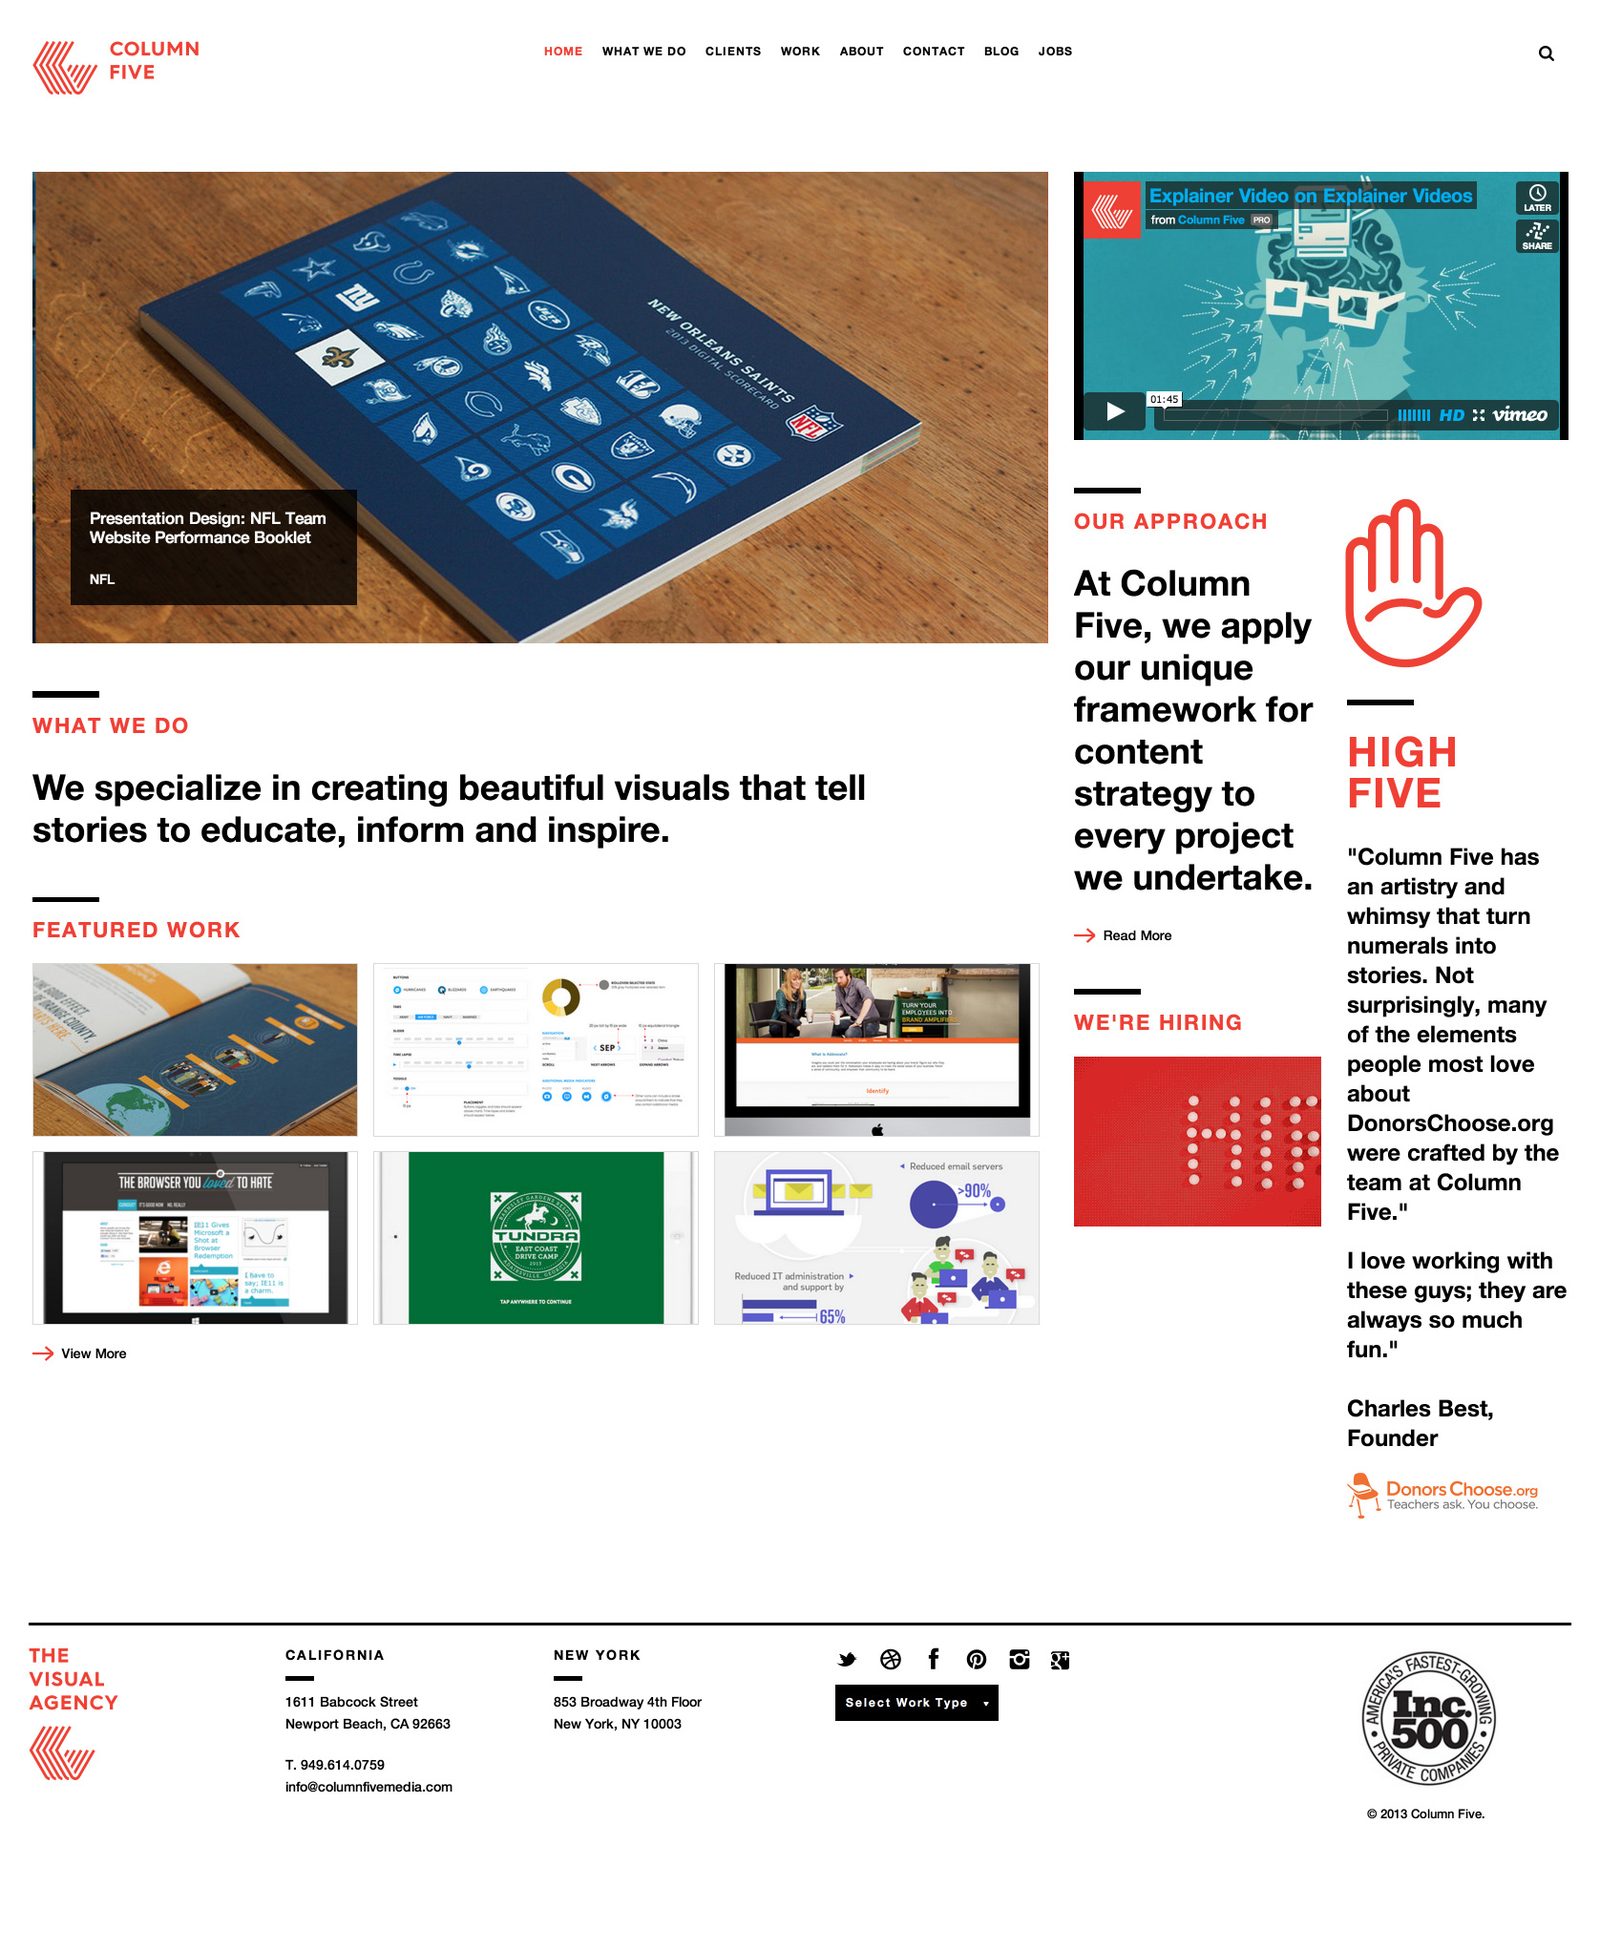
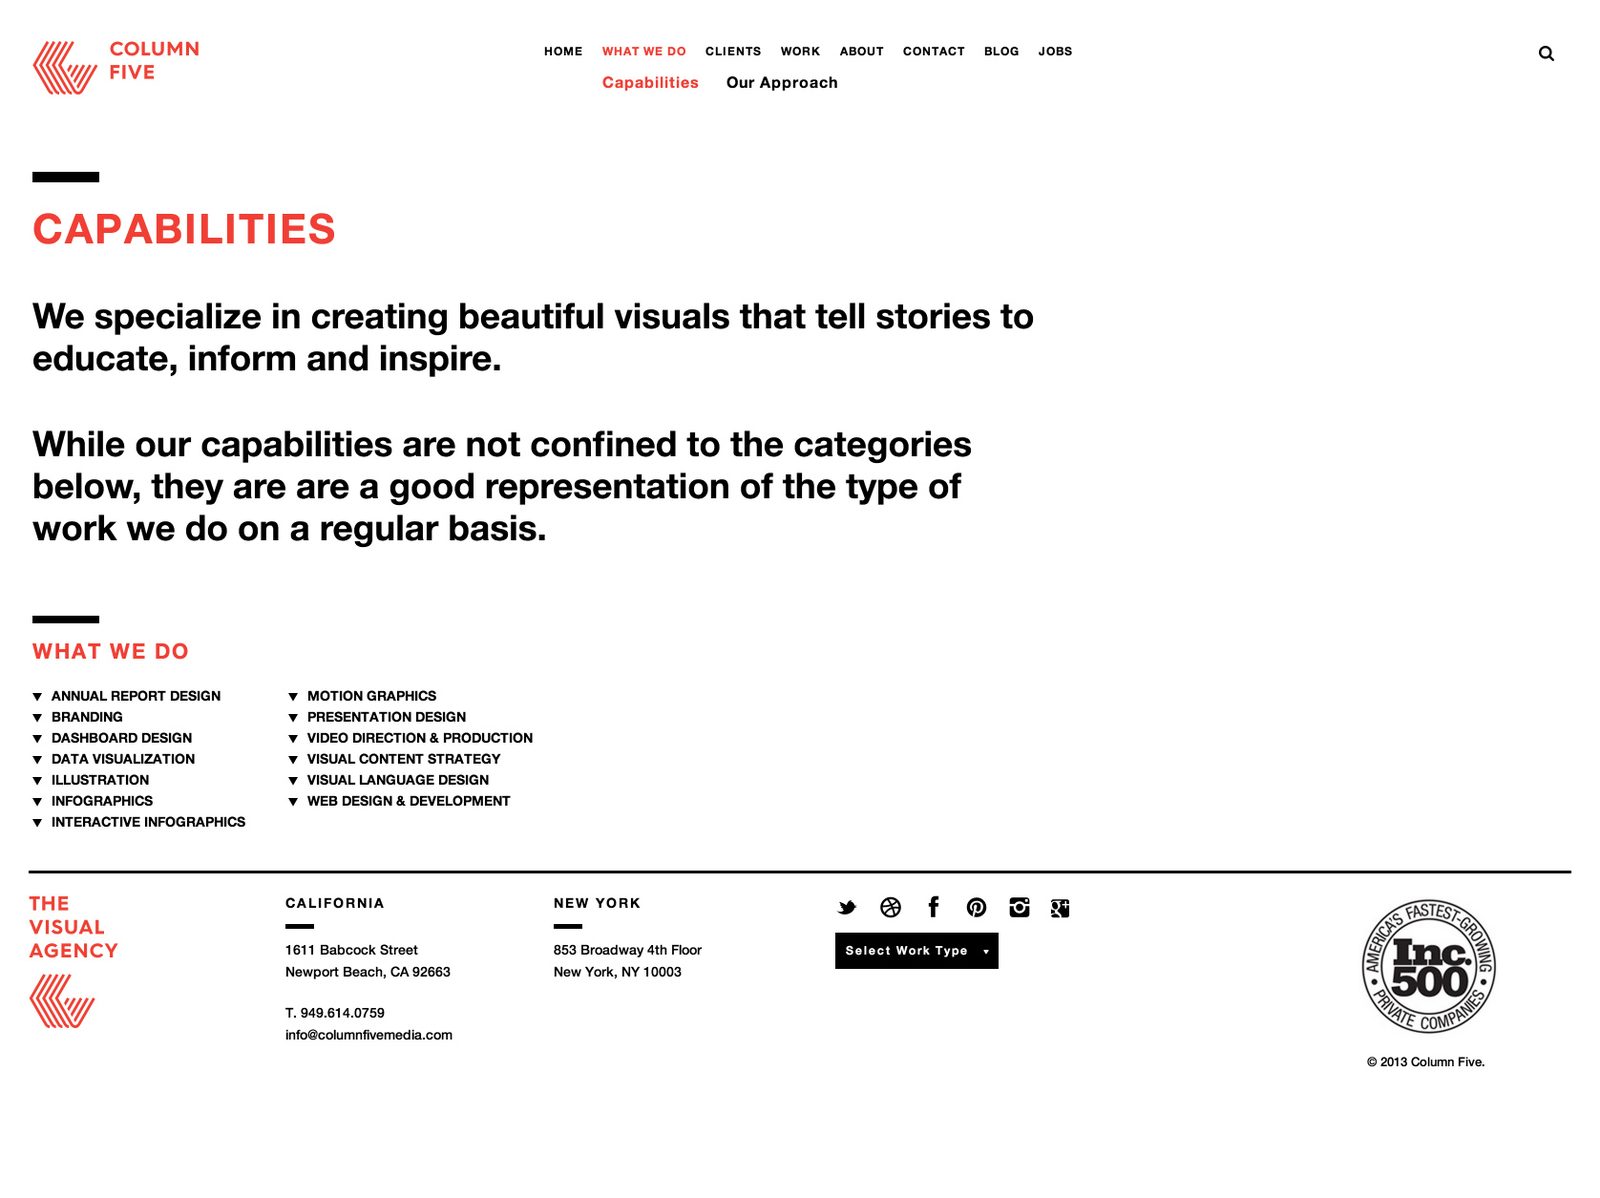
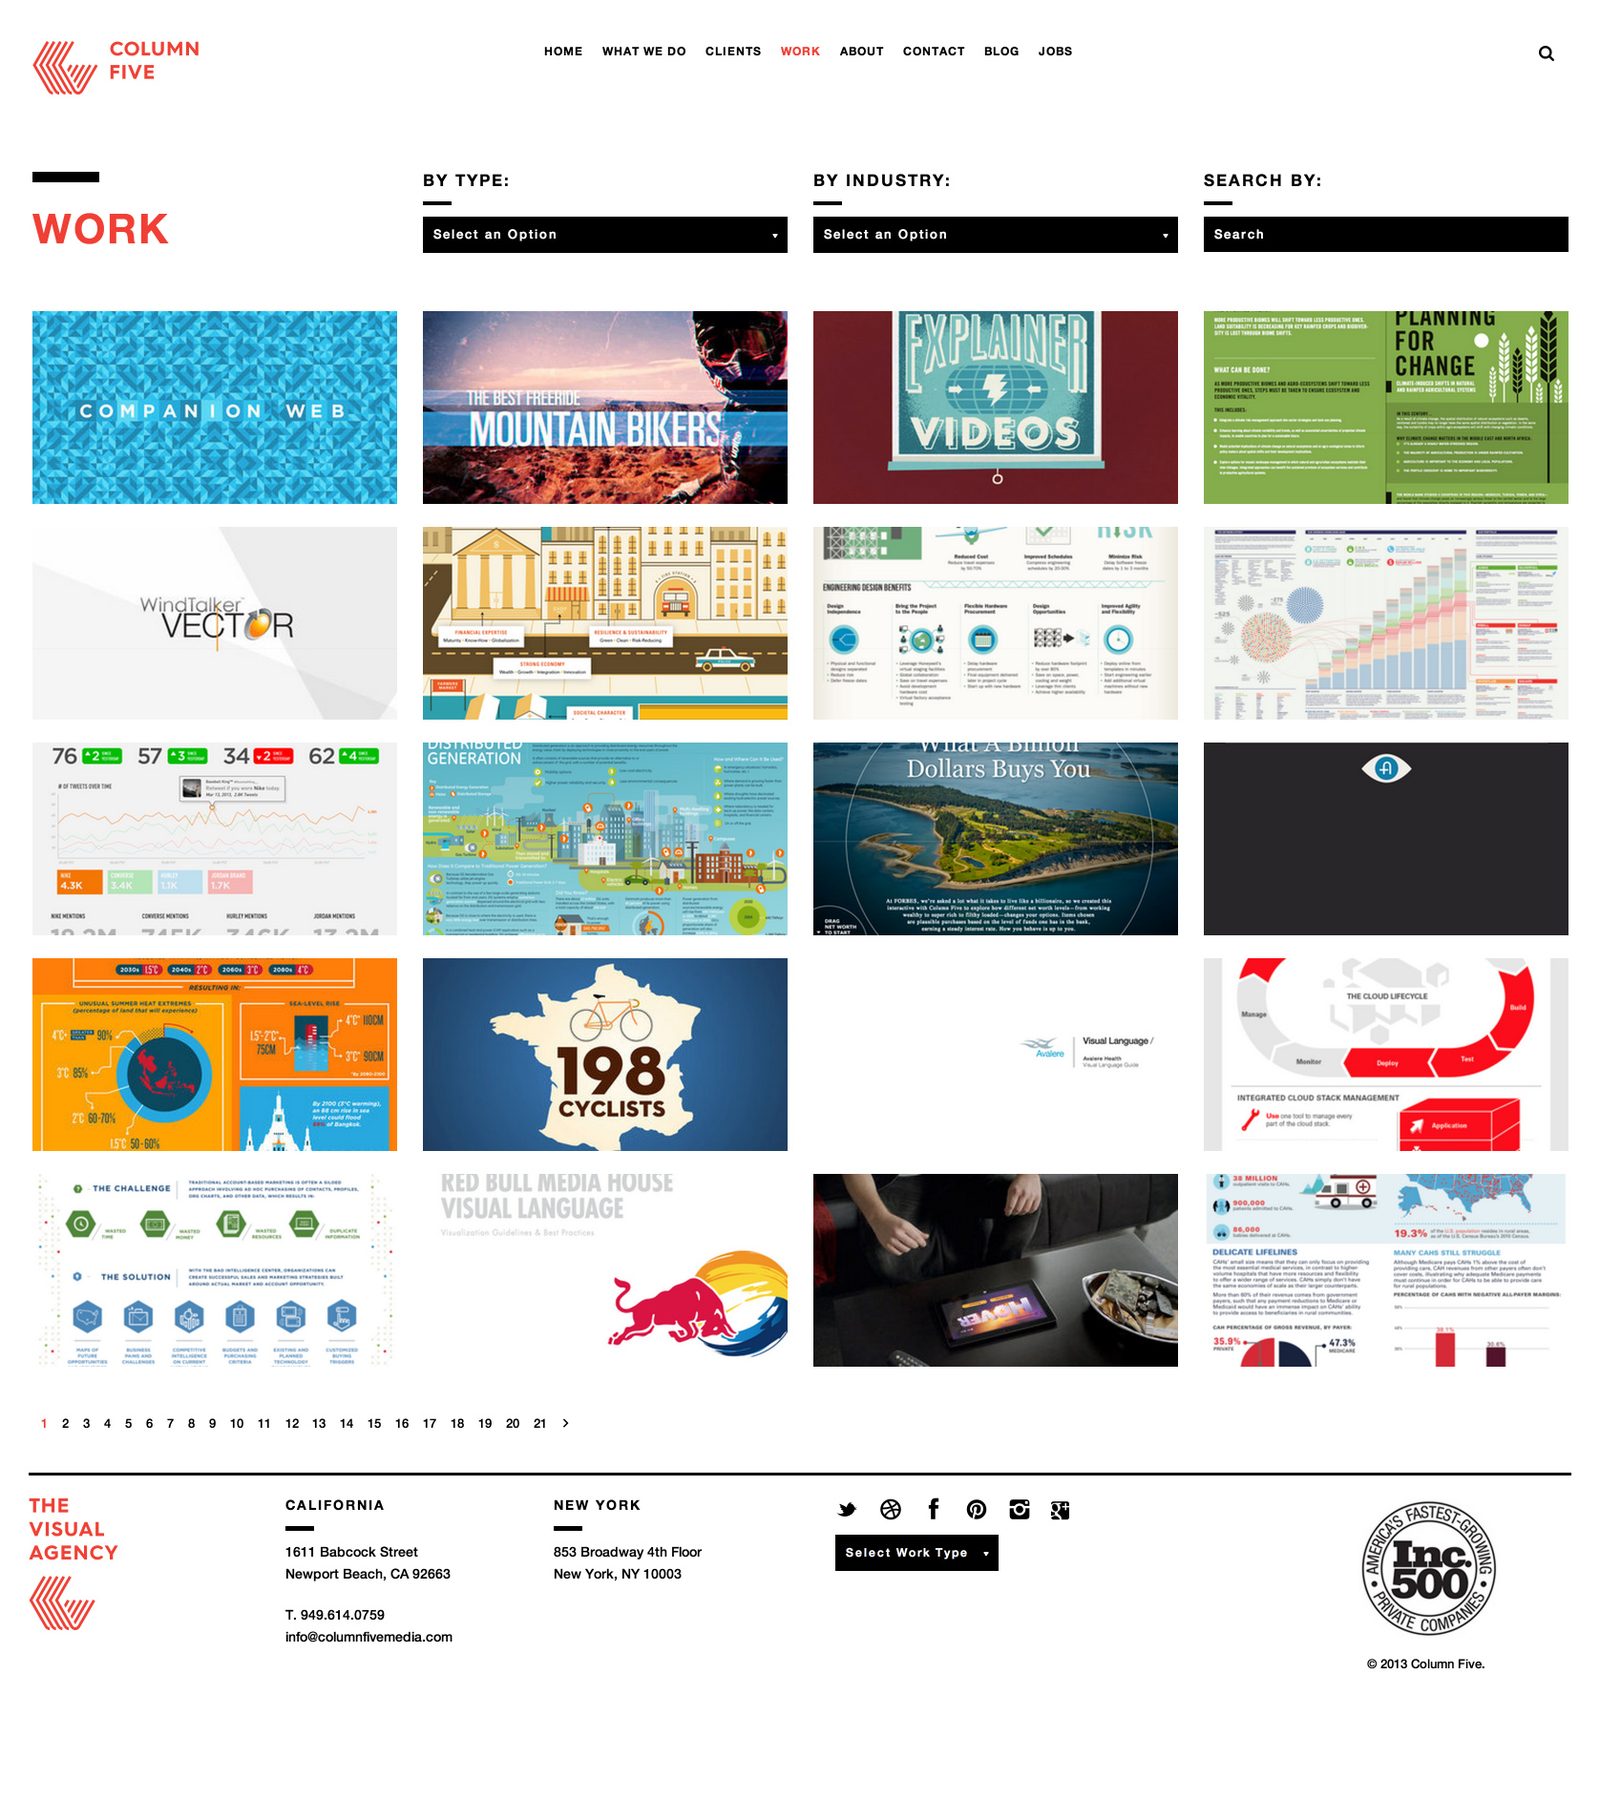
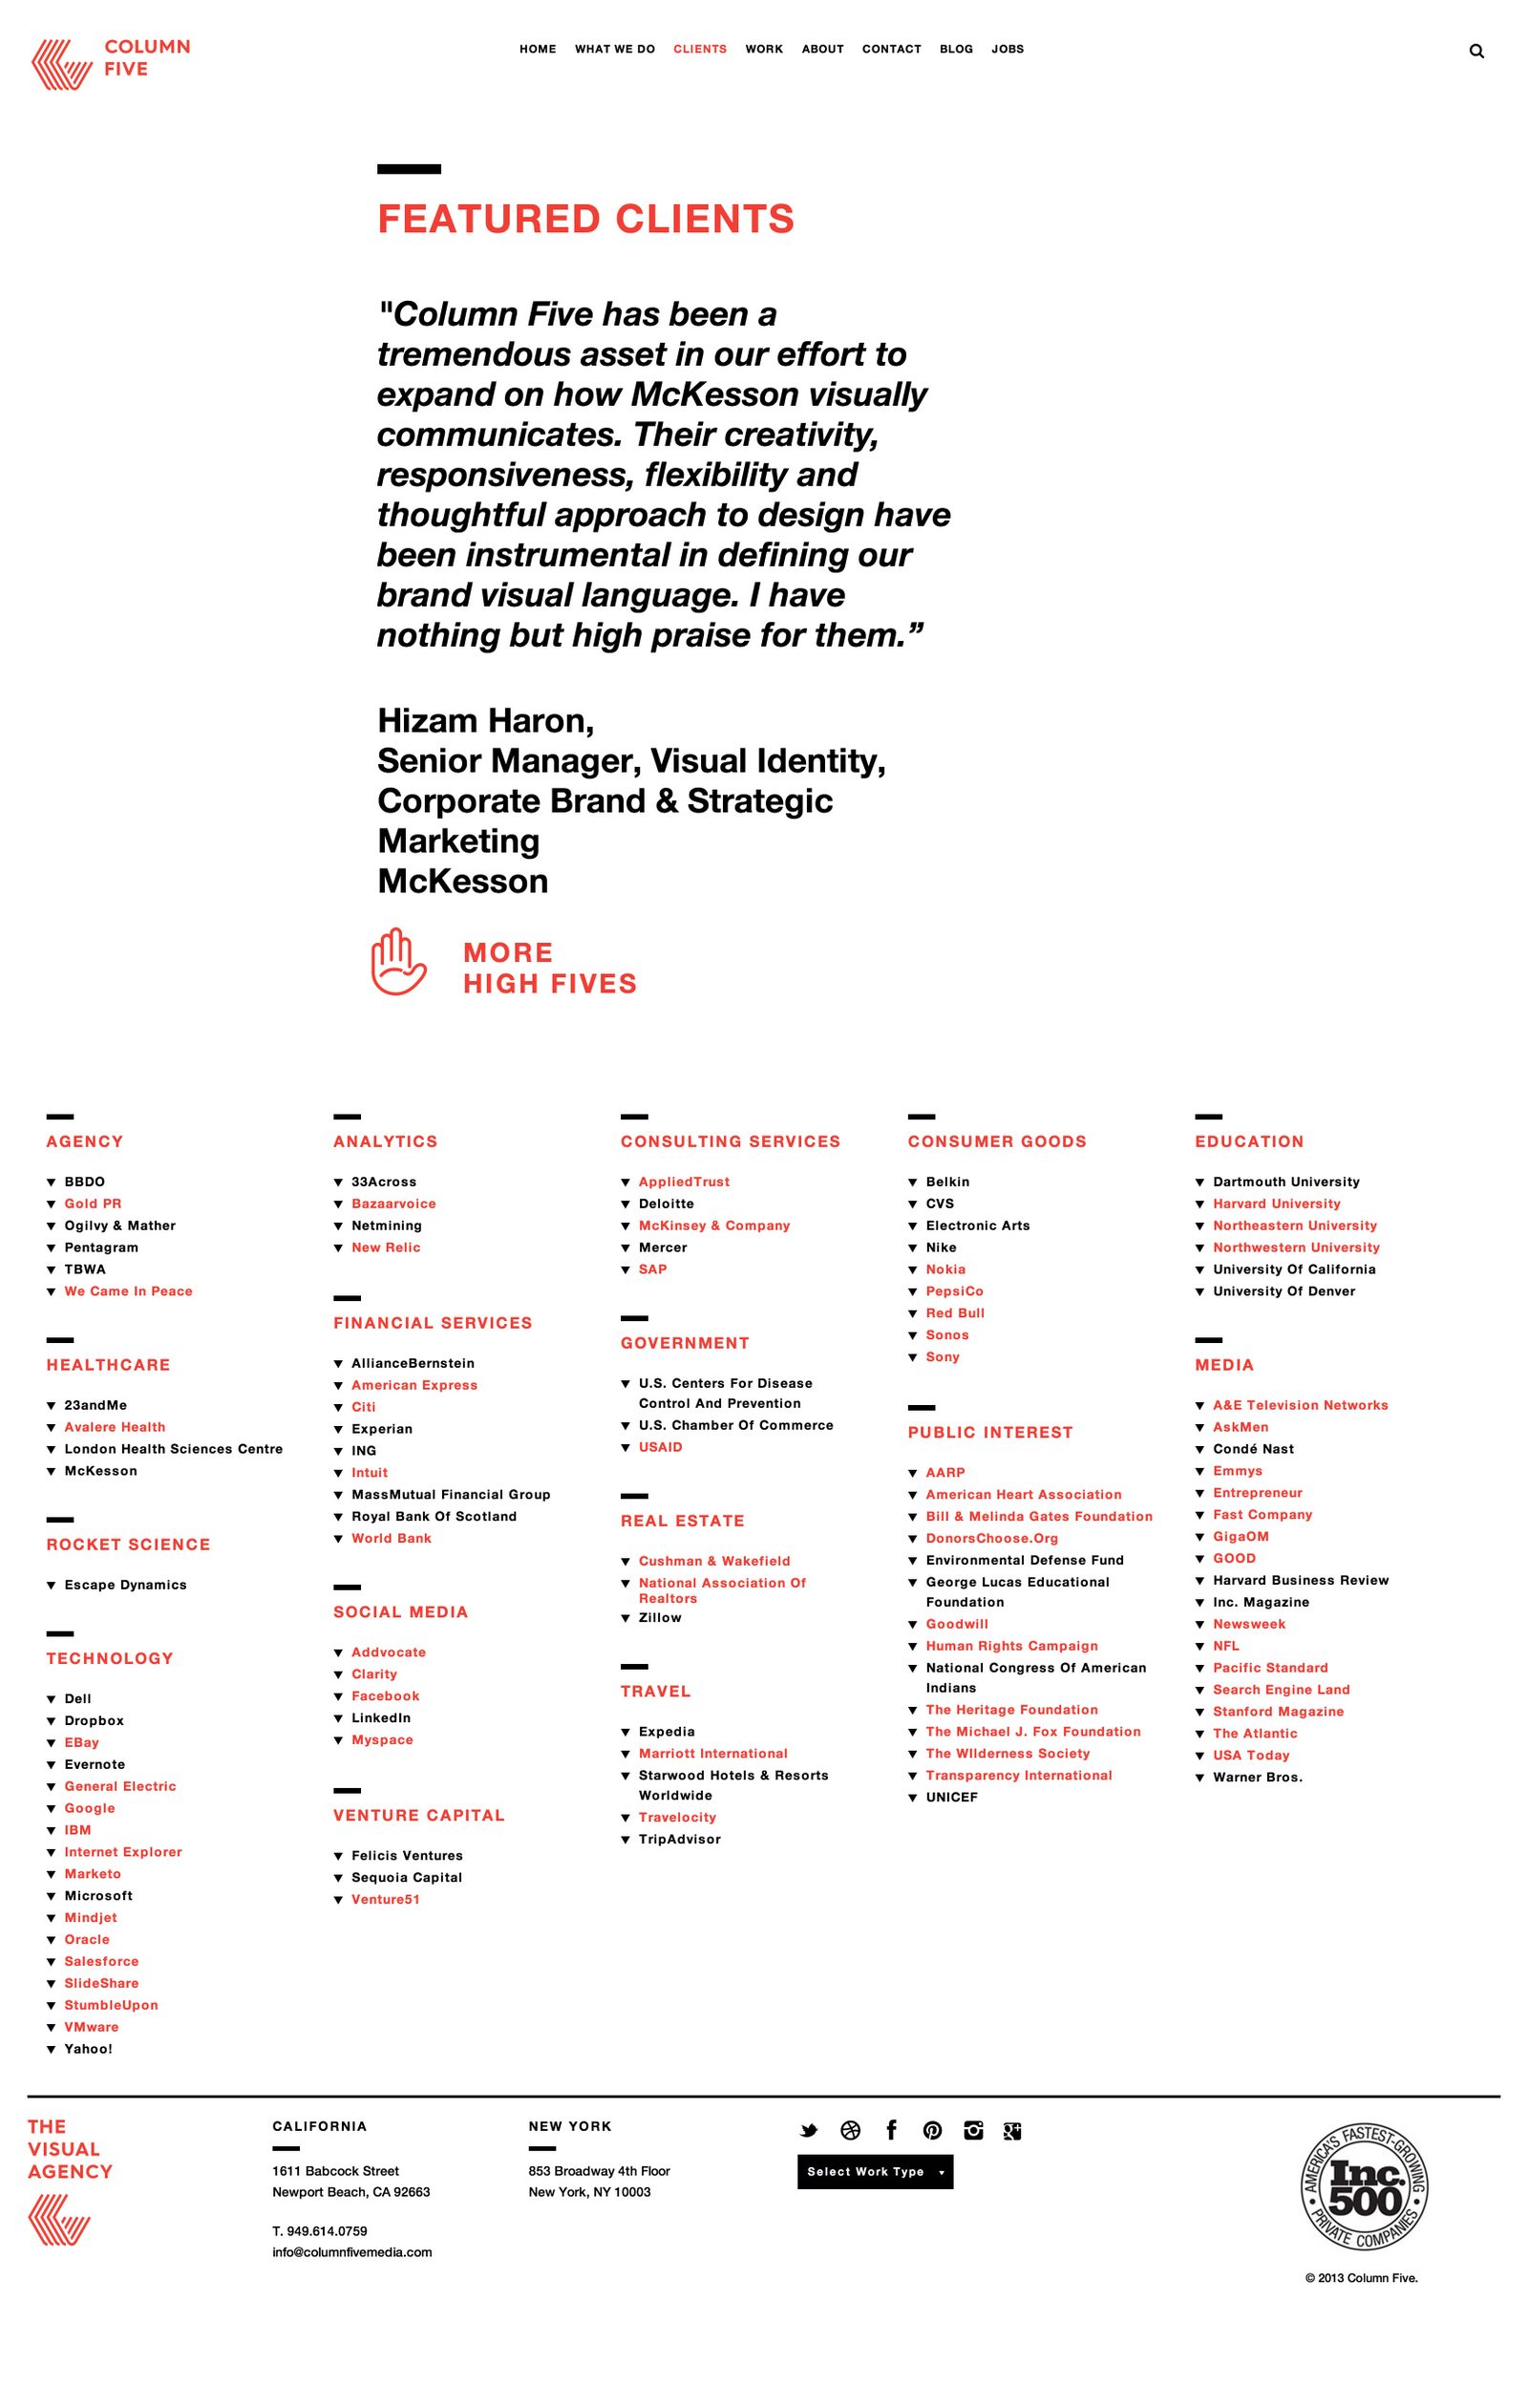
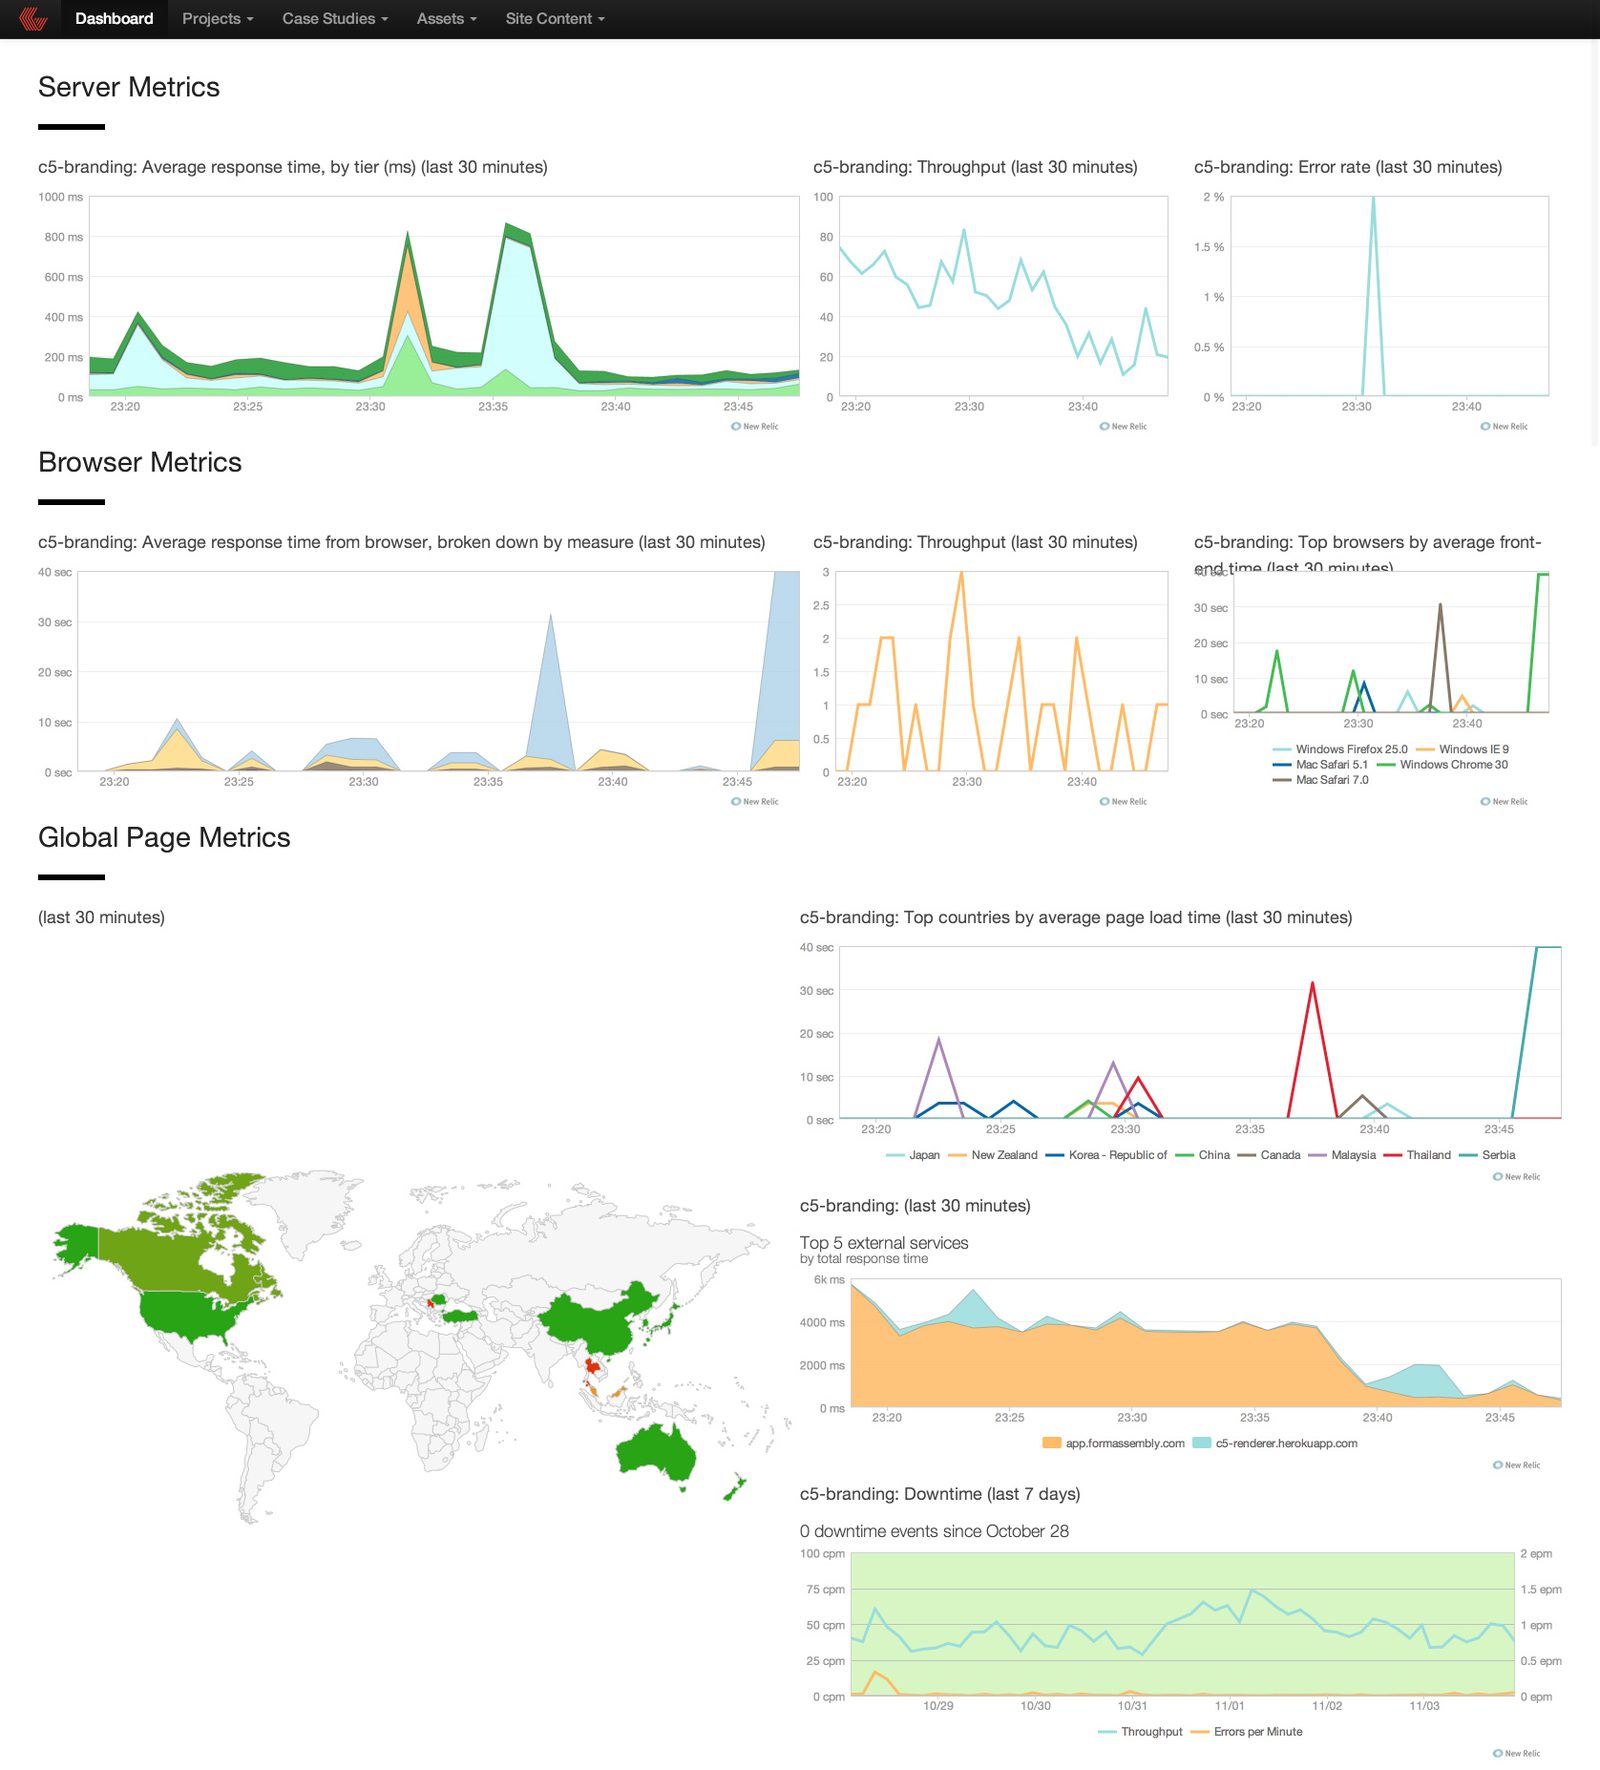
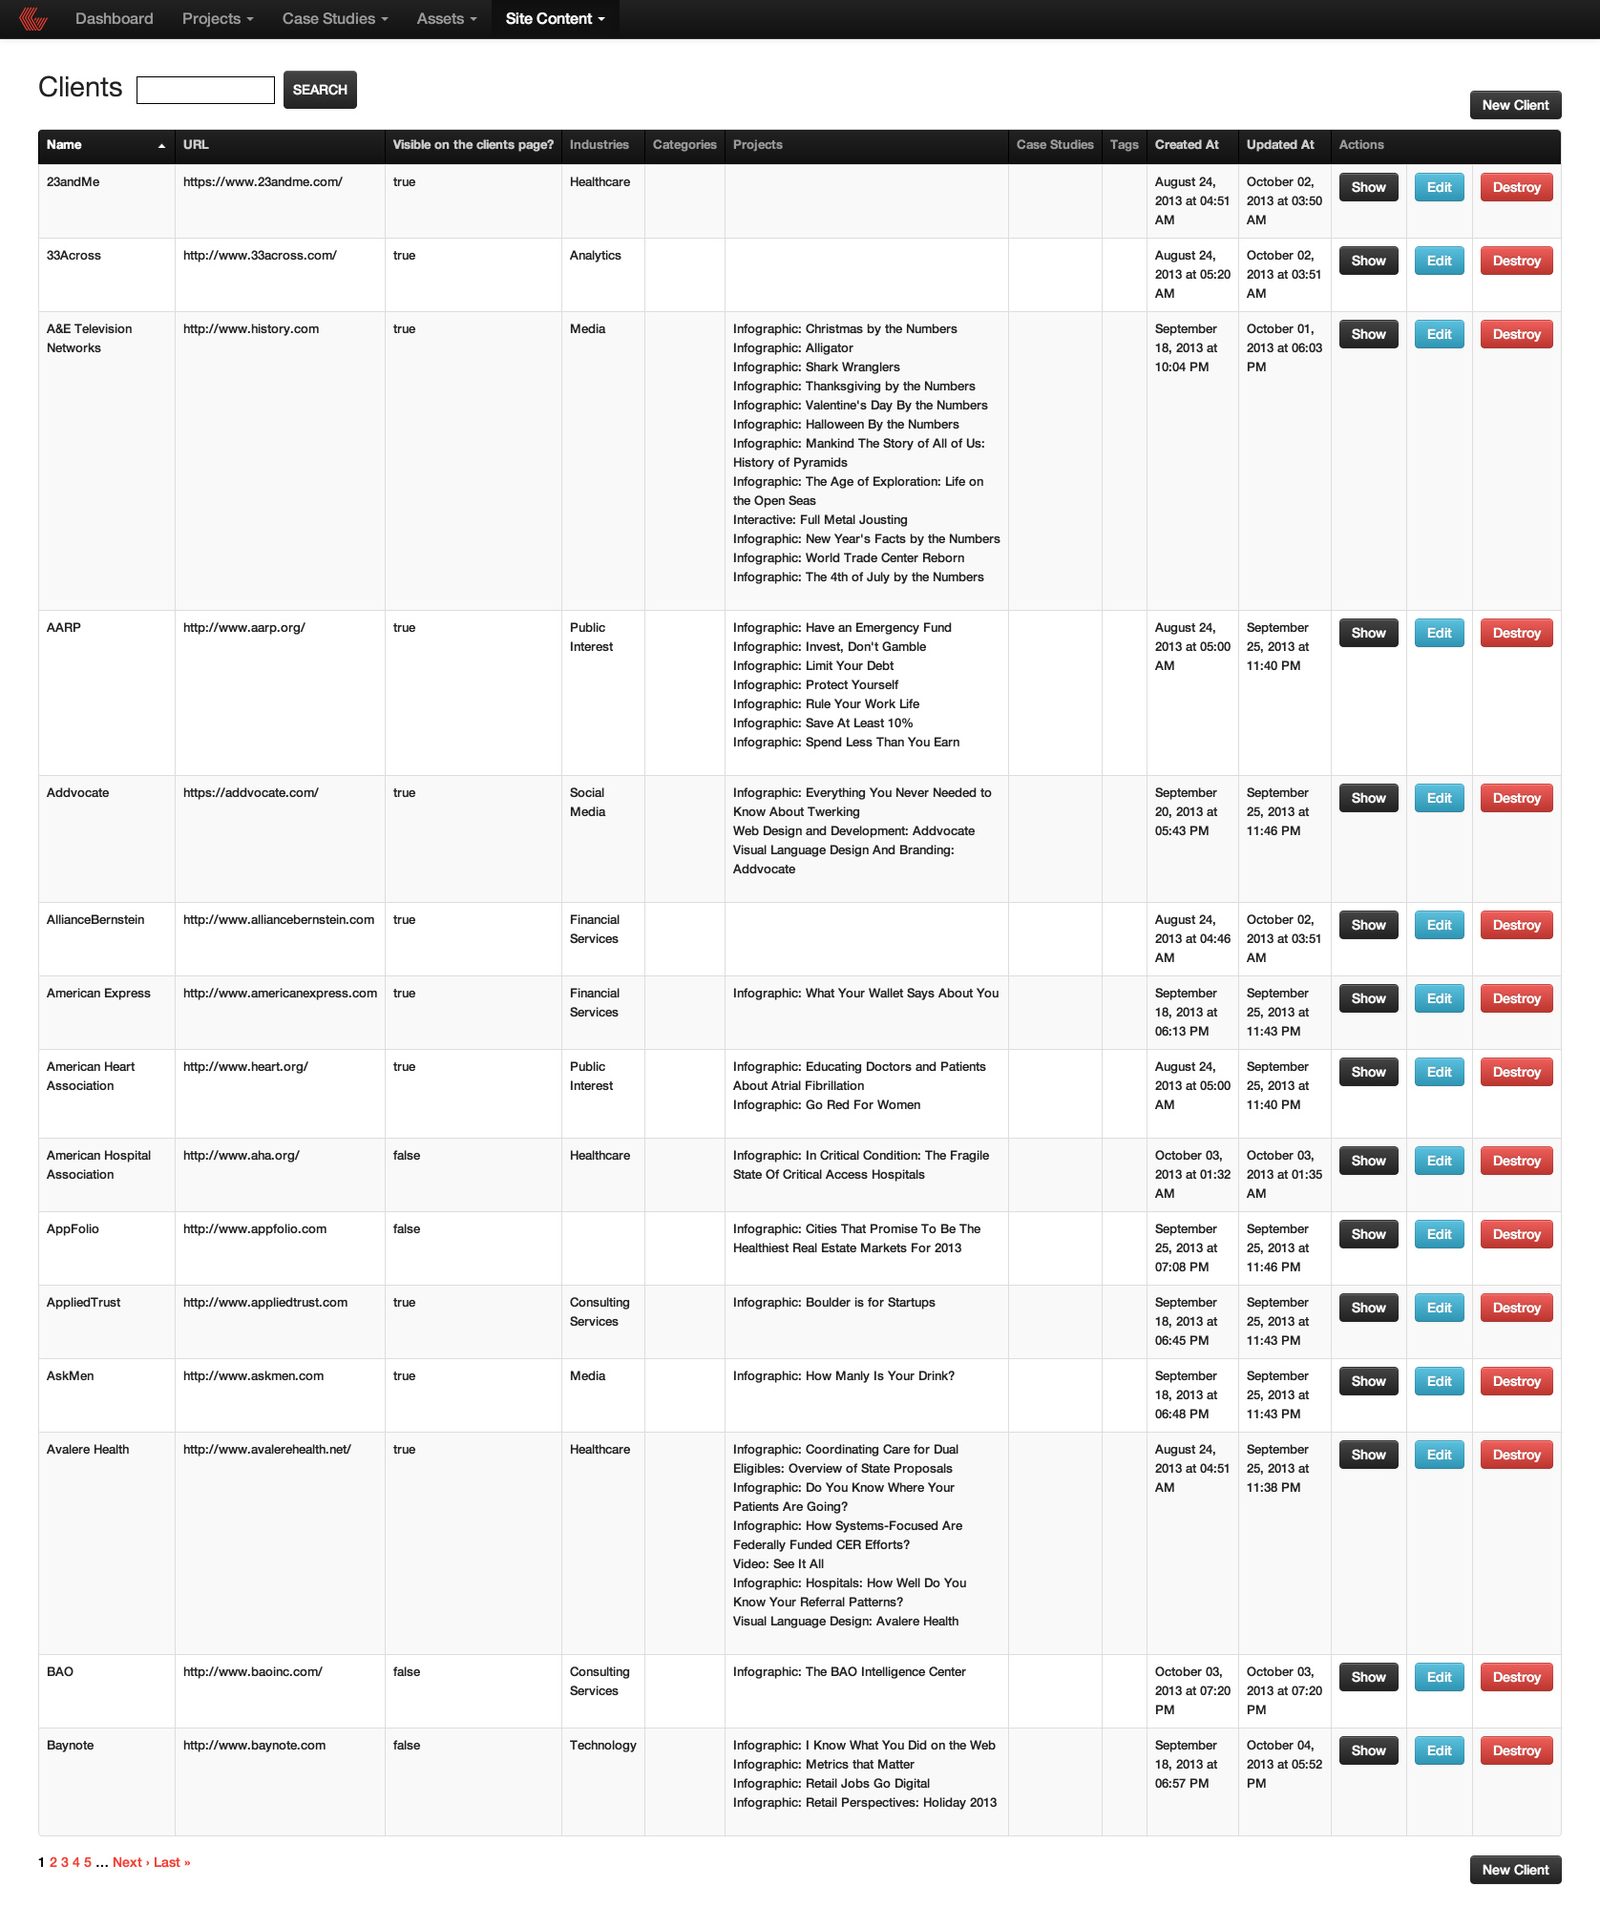
The 2013 site ran on Swiss discipline. Every section opens the same way: a short black rule, a red label in tracked capitals, then one large black statement. The home leads with a single piece of work and the studio’s approach; the work index filters twenty-one pages of projects by type, industry and search; capabilities is a list of thirteen; the clients page sorts the roster into sixteen industries. Behind it, the admin keeps every project, case study, asset and client in one place, and opens on the health of the site.
Five stripes
Five parallel red strokes folding into a C: a column of five, literally.
Rule, label, statement
One opening for every section, so hundreds of projects still read as one voice.
The work is the hero
Booklets, explainers and charts get the room photographs usually get.
High five
Testimonials signed off with a hand-drawn high five: rigorous, never cold.
The work
Brand system
Seen again years later, the site was already most of a brand. I locked what it held (signal red, black and white, a heavy grotesk with tracked red labels, the five-stripe mark and the Visual Agency badge, data as the hero image) and followed it into print, product, a data-visualisation system, a campaign, an editorial spread and a storefront.
 Brand world · rendered from the locked brand DNA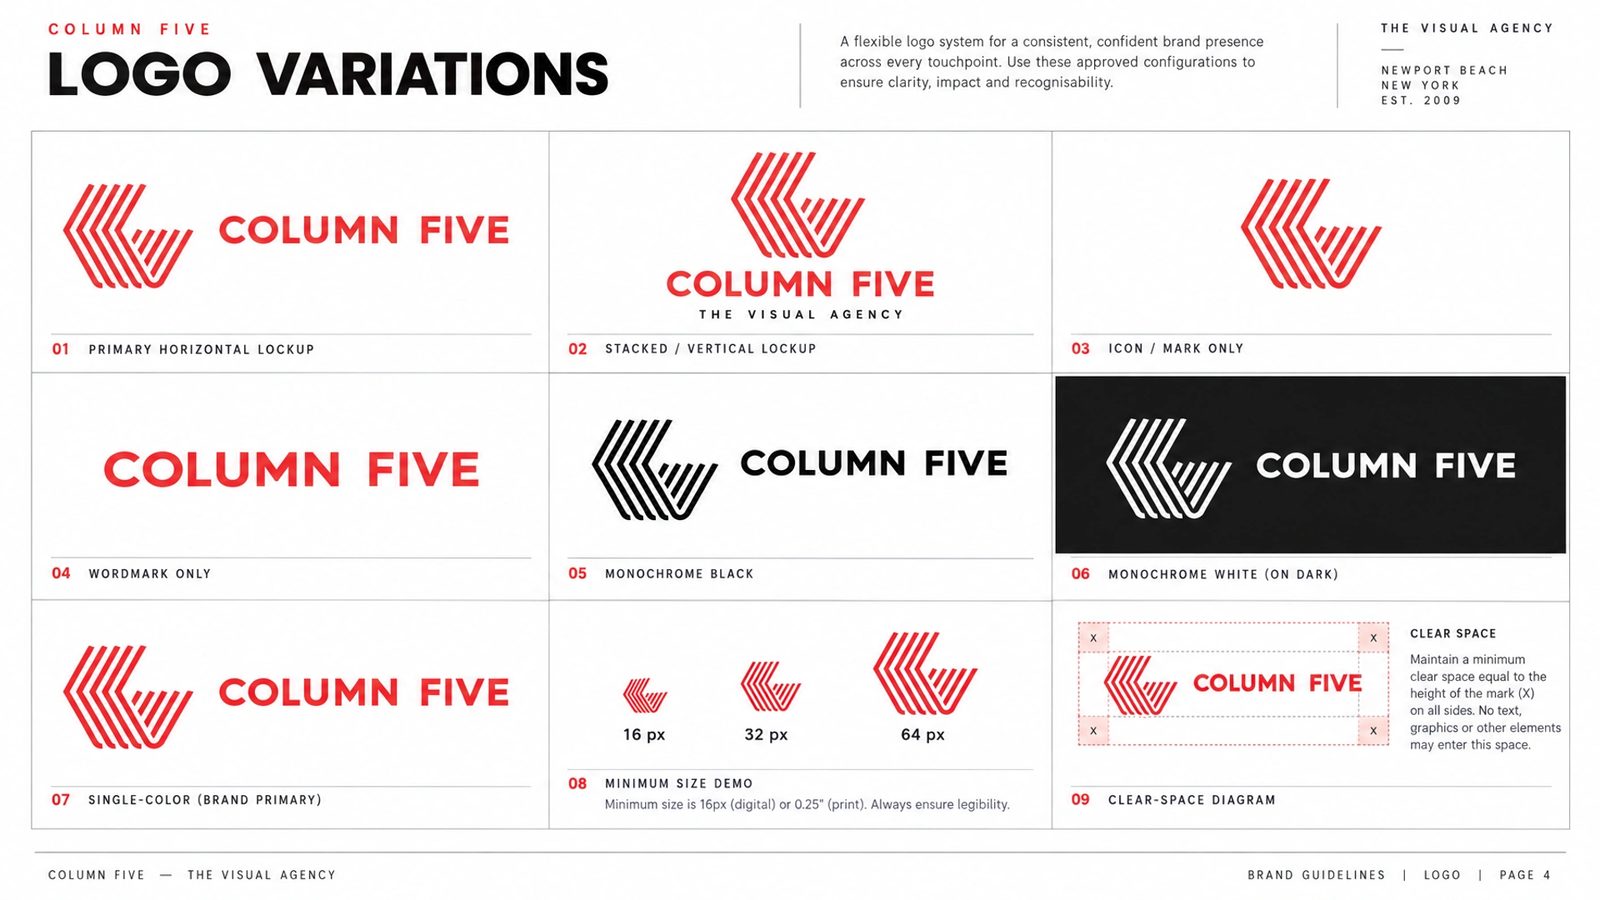
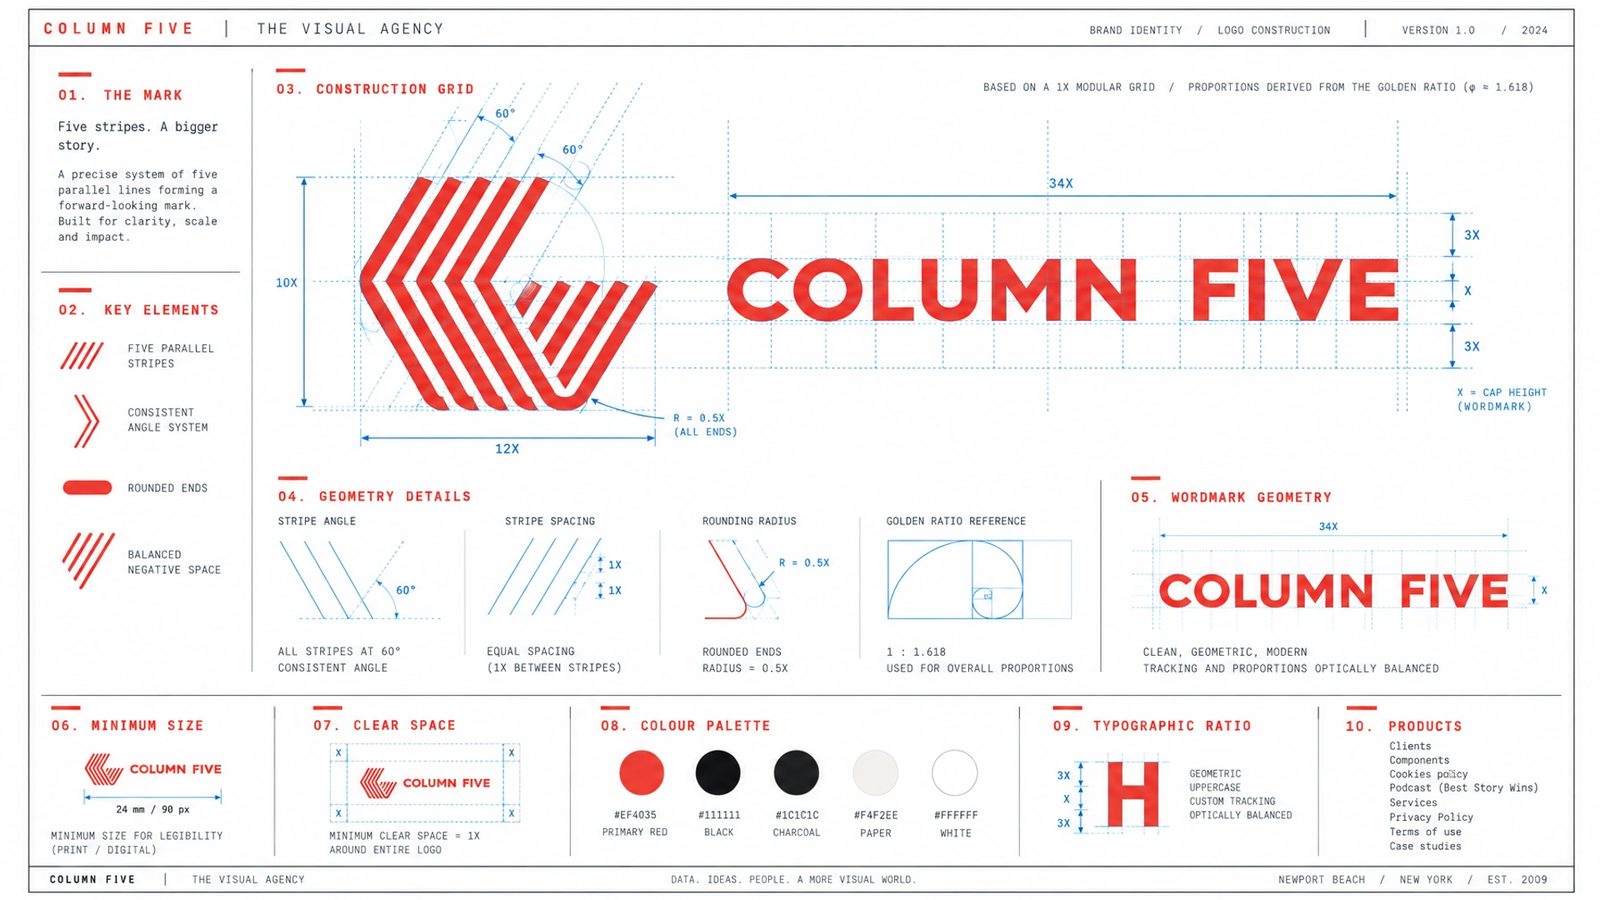
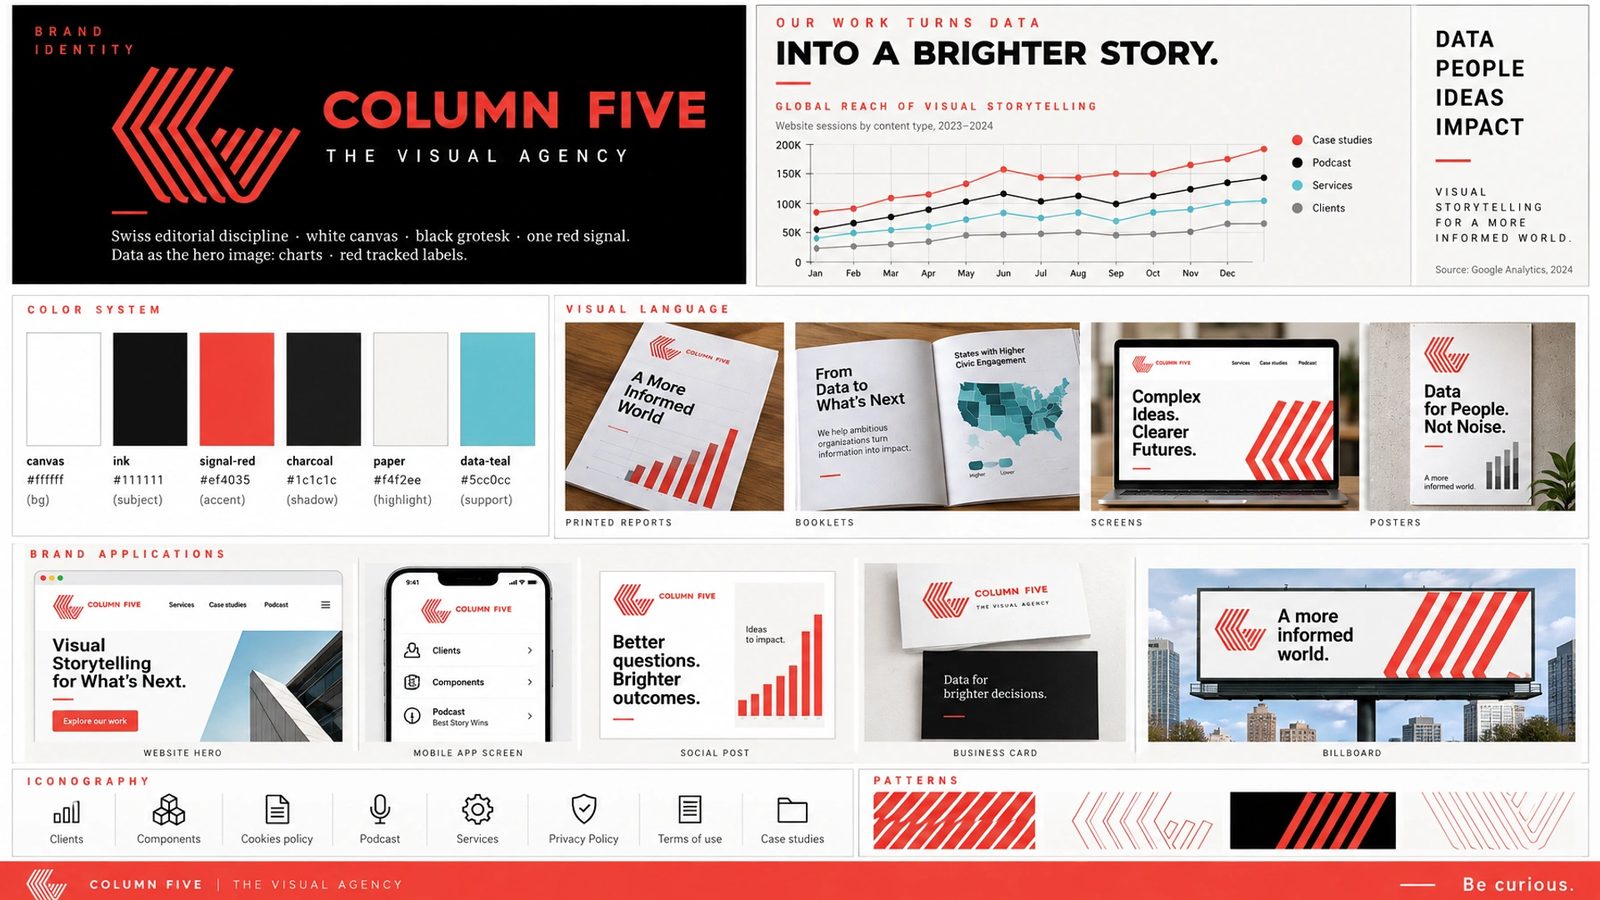
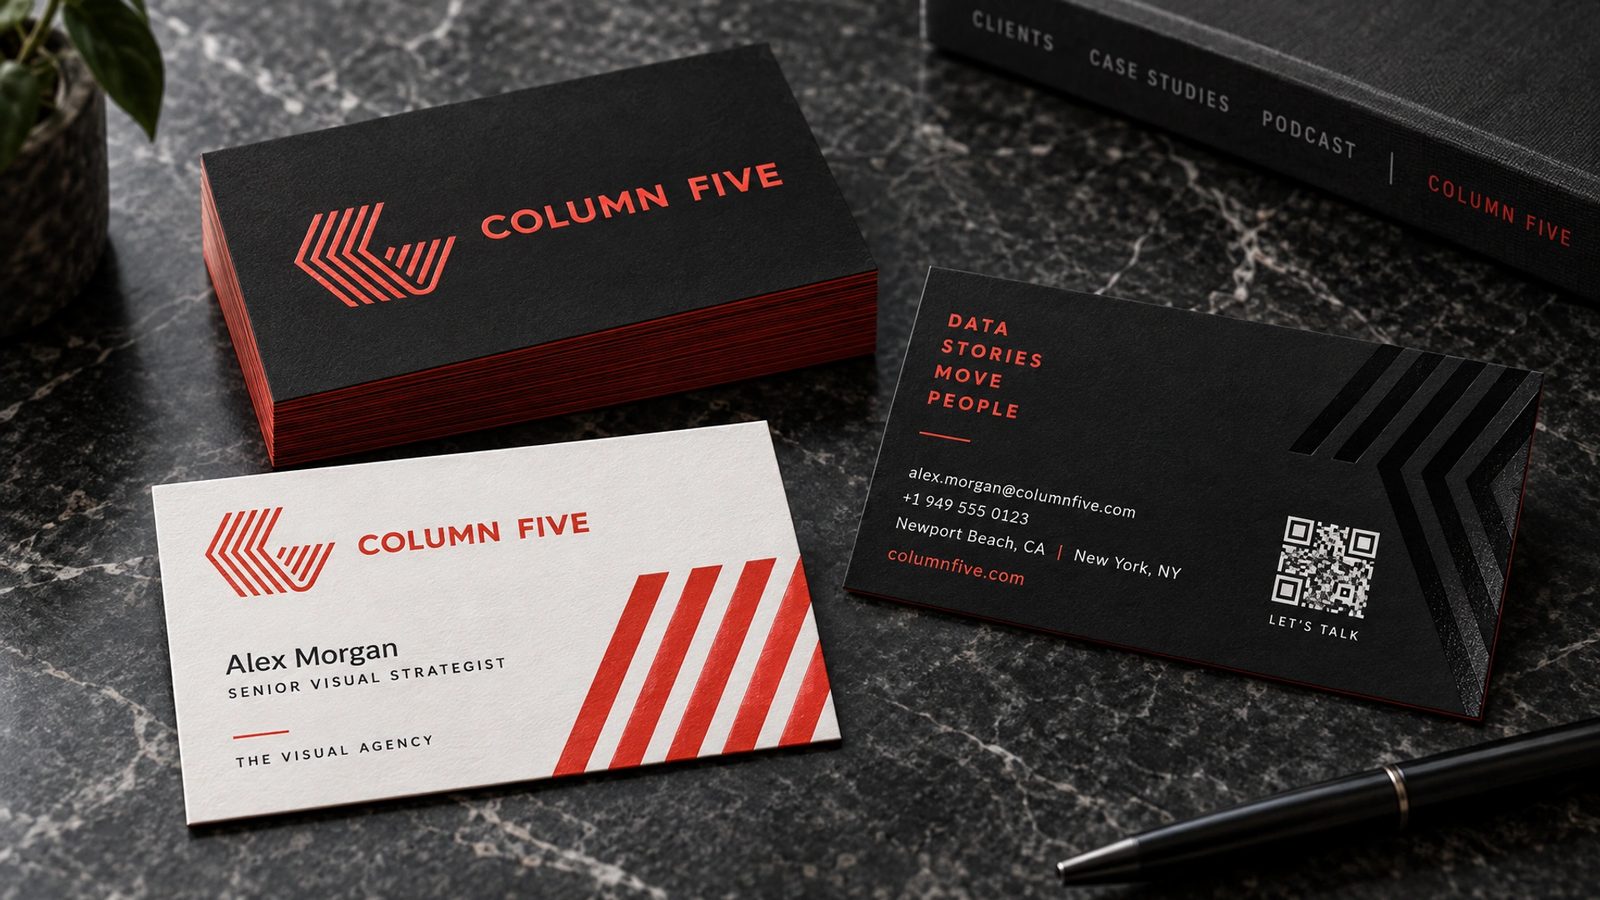
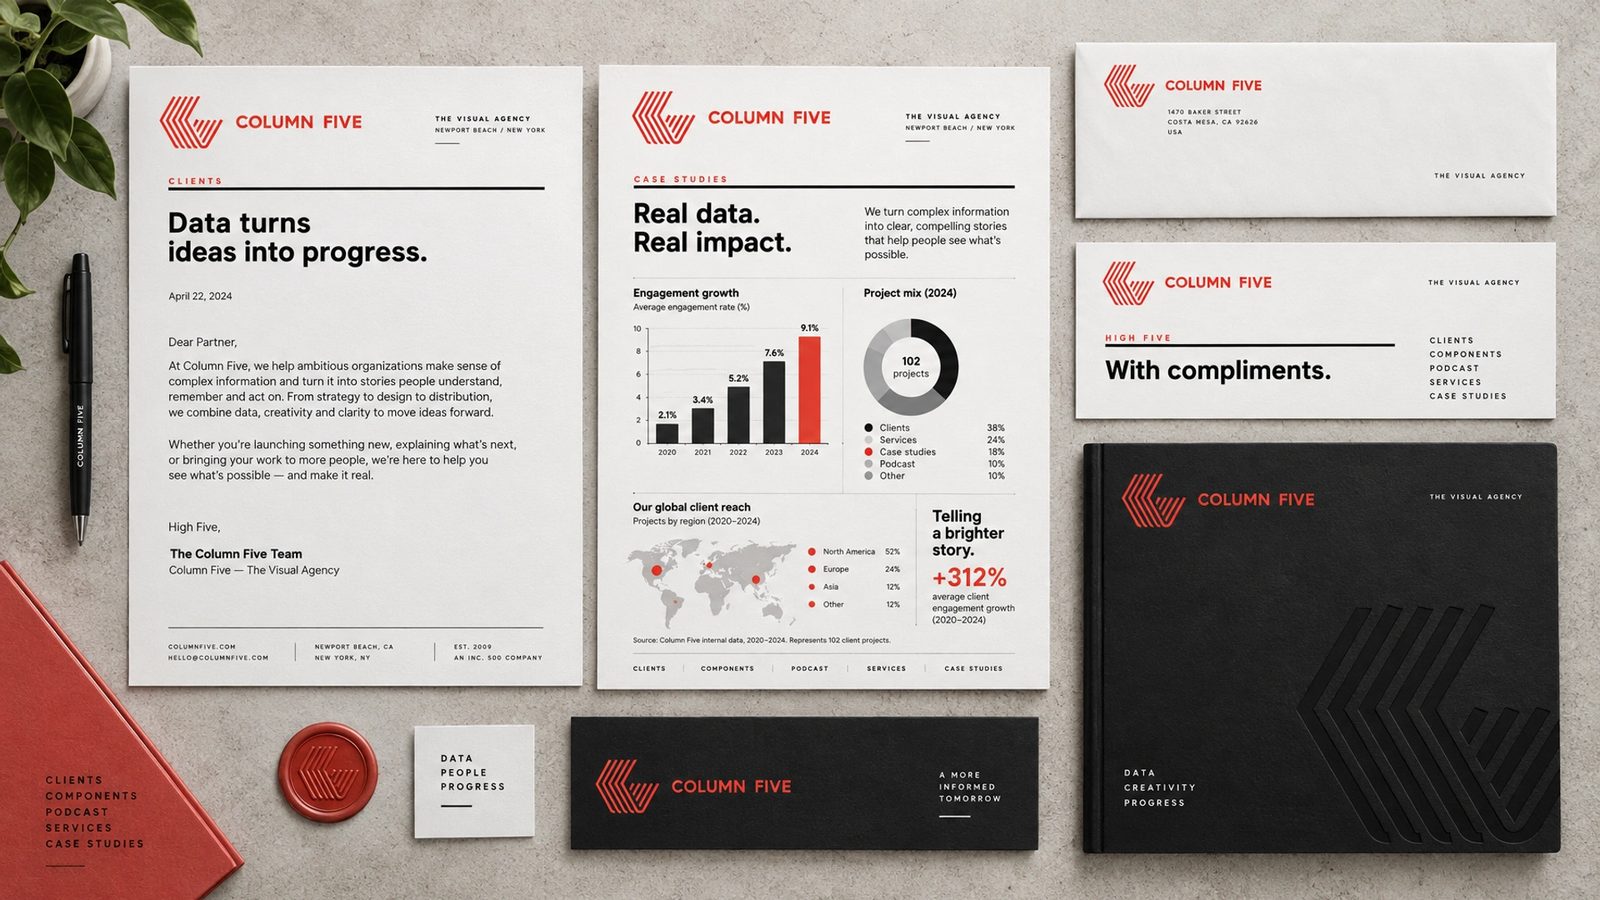
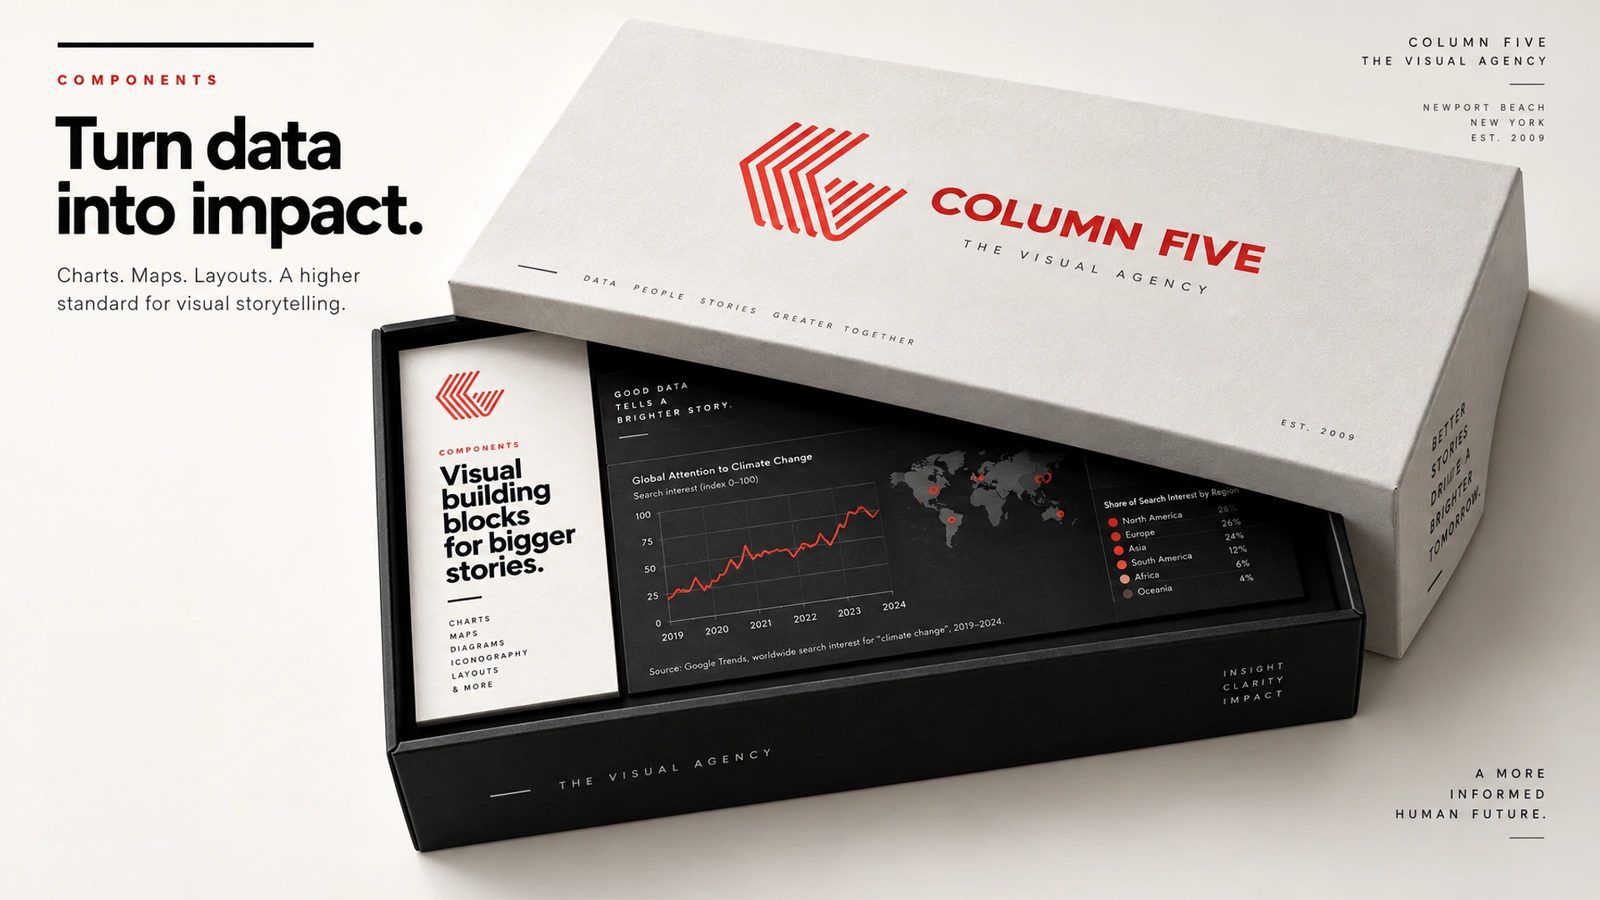
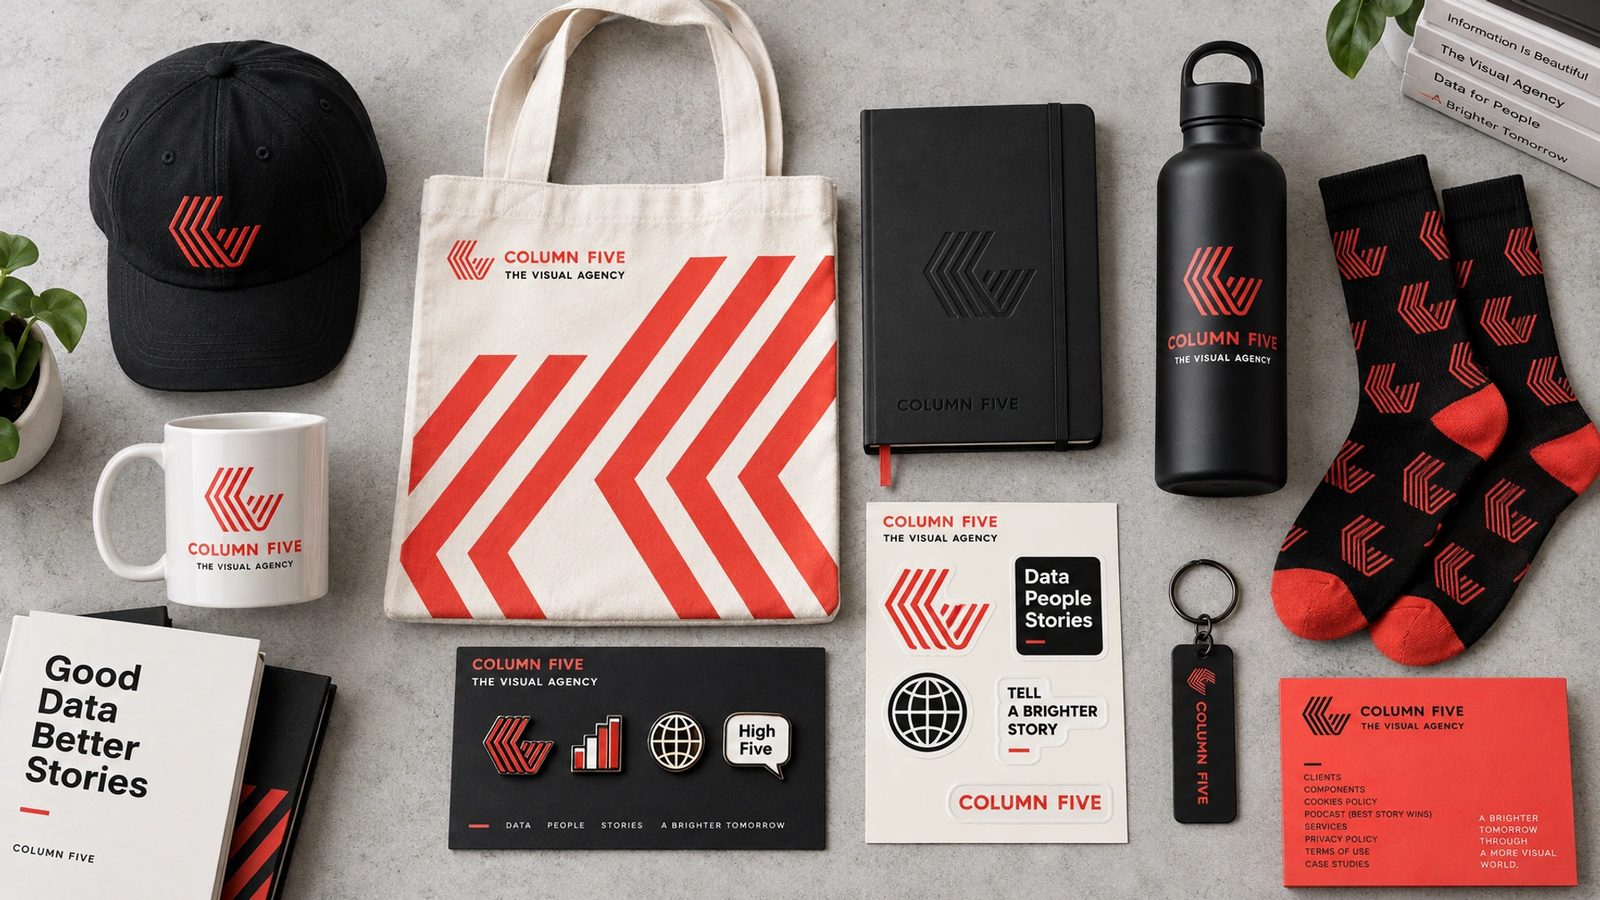
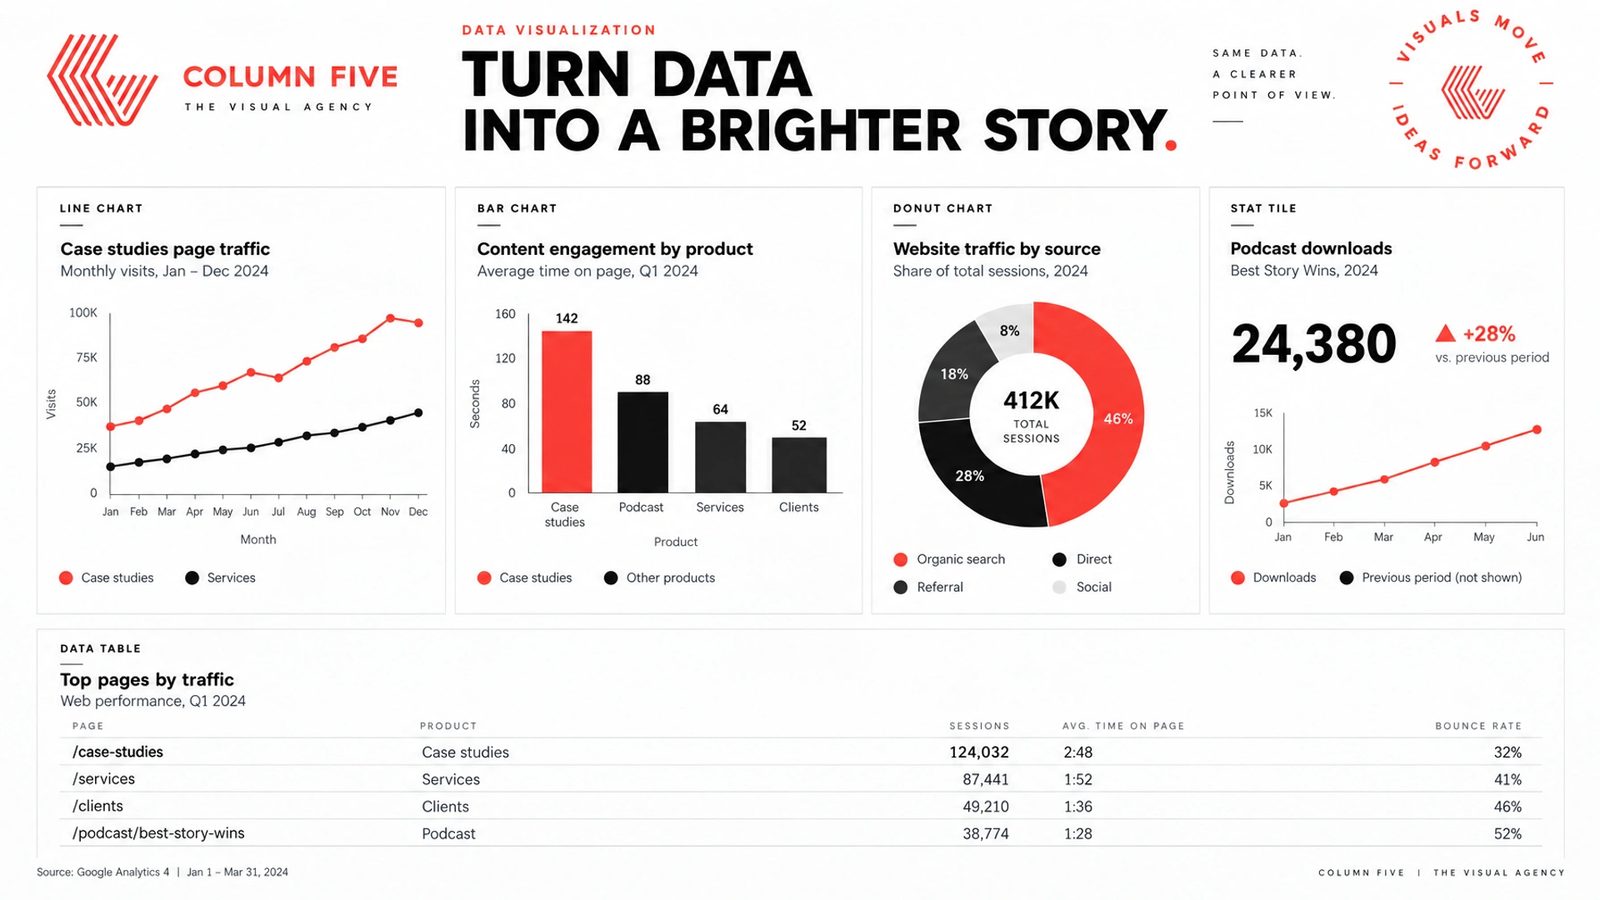
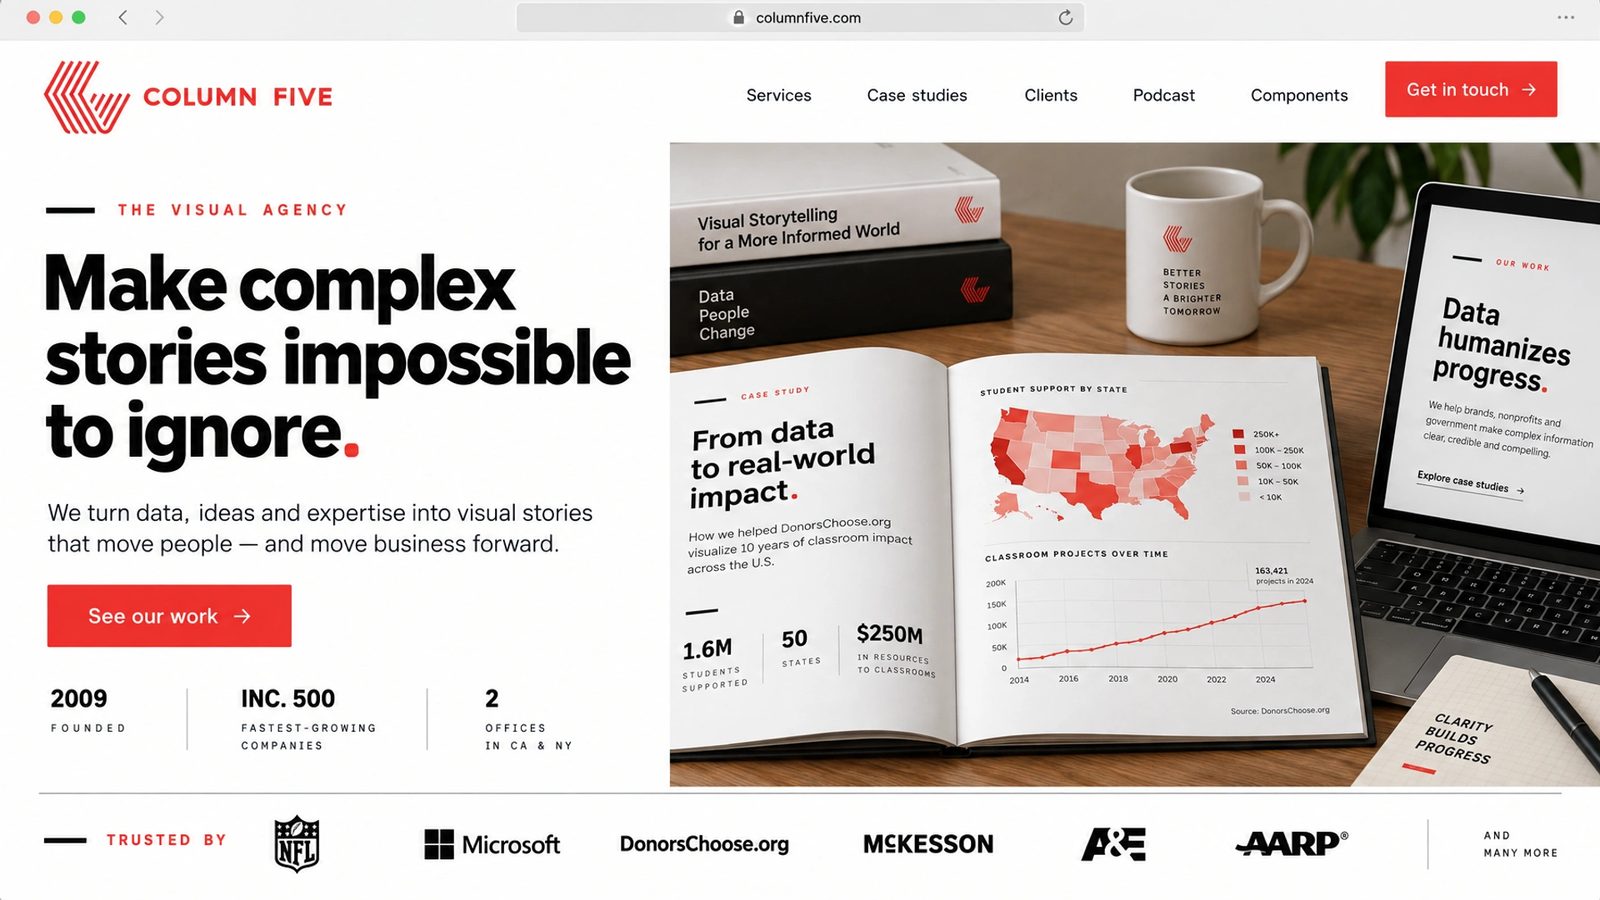
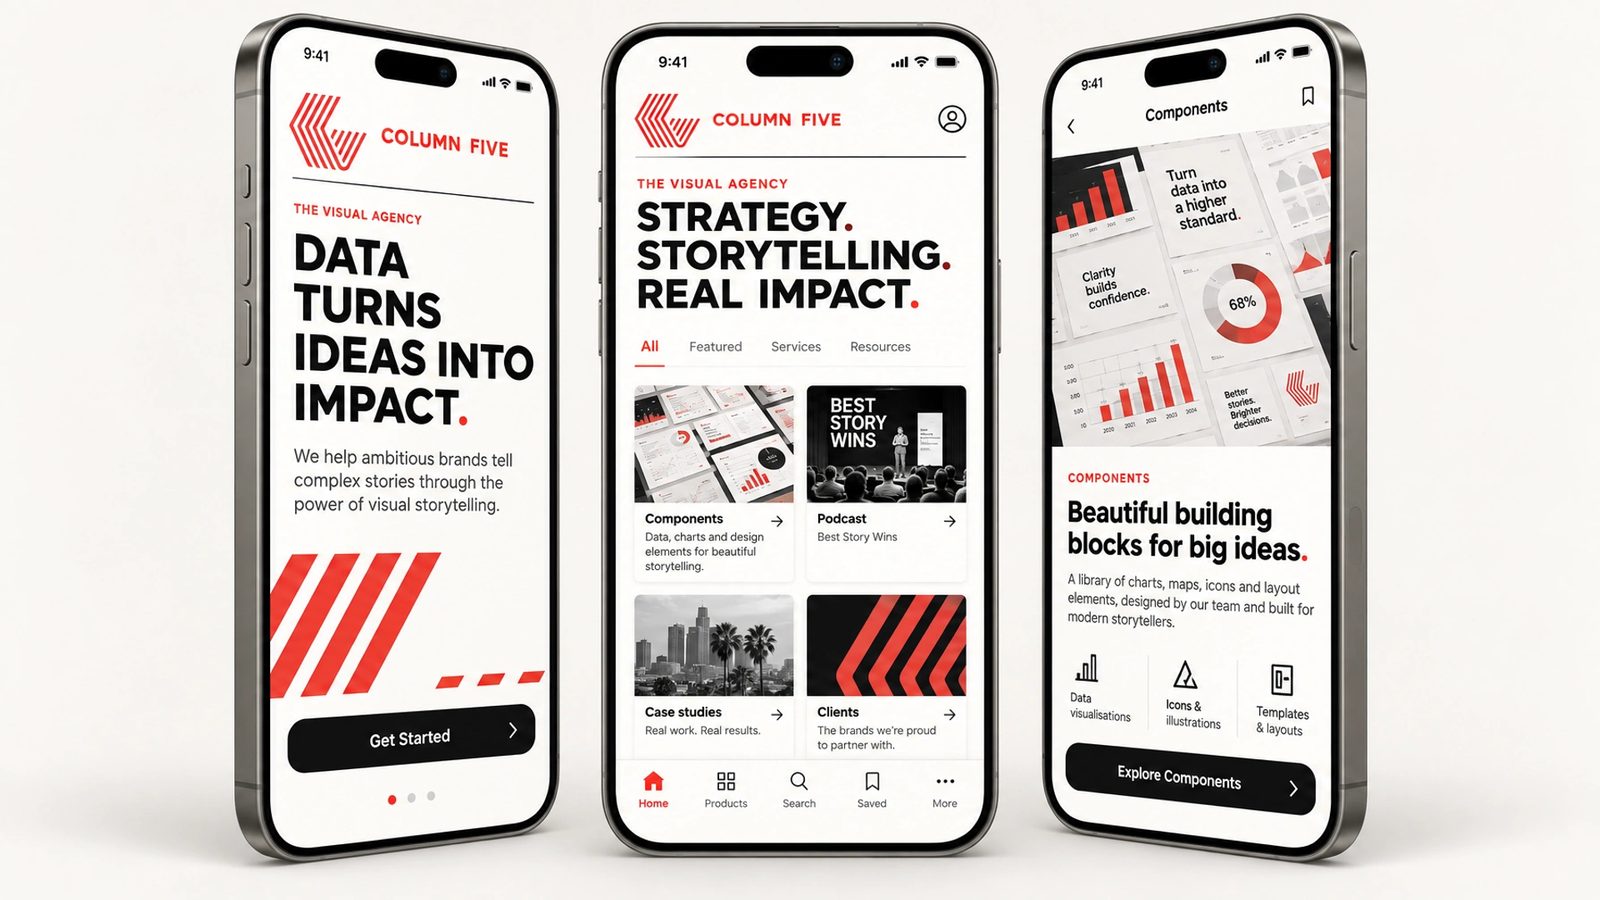
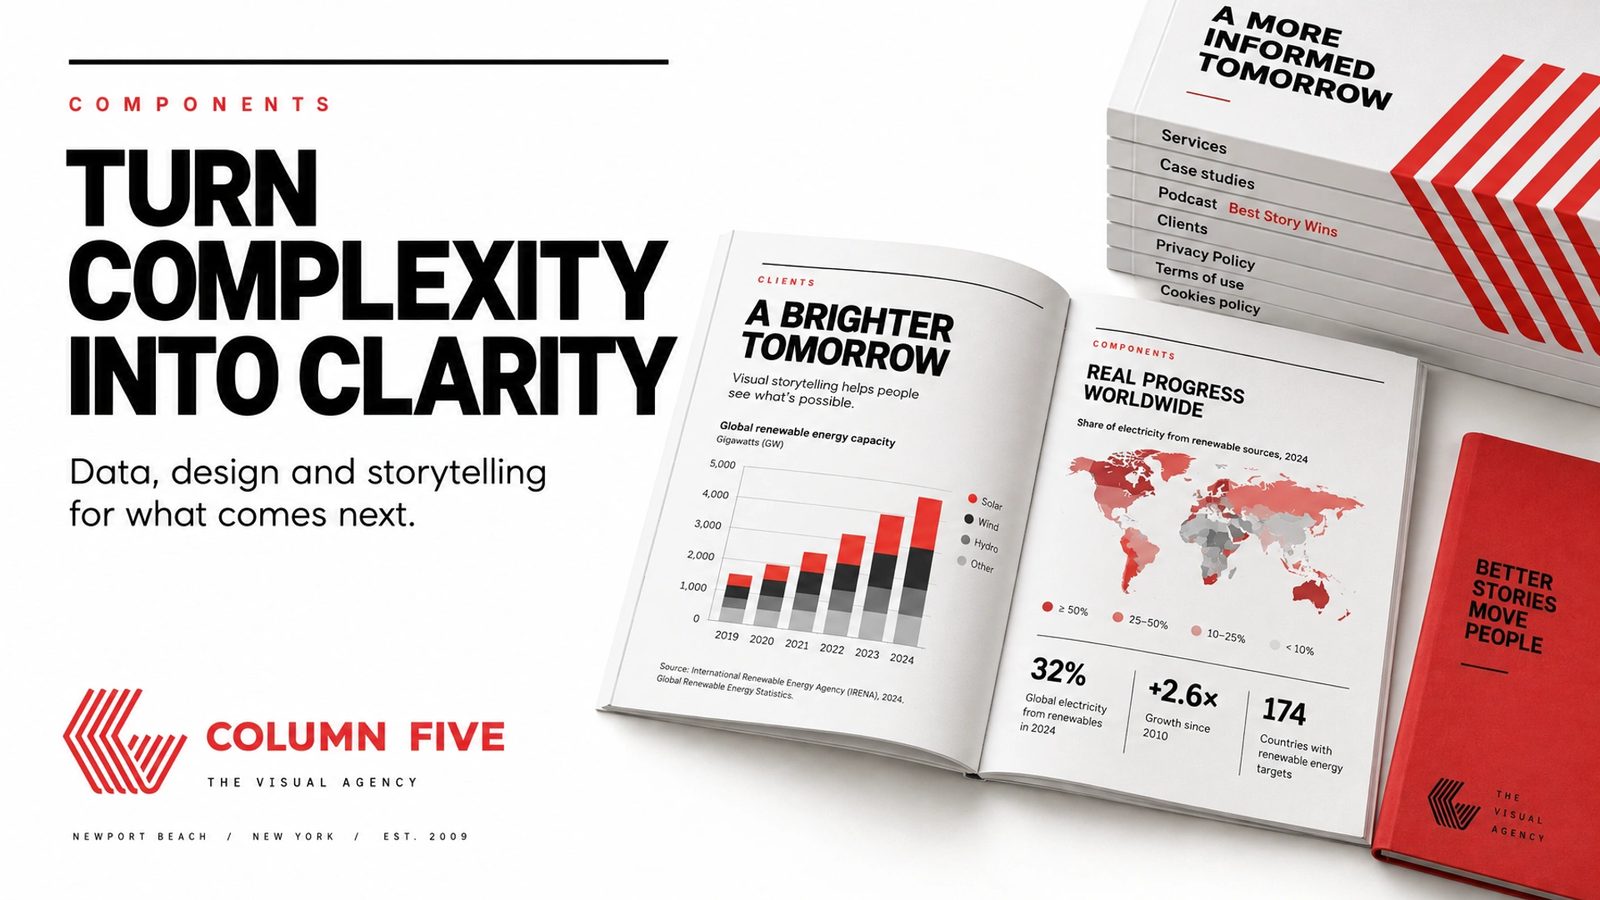
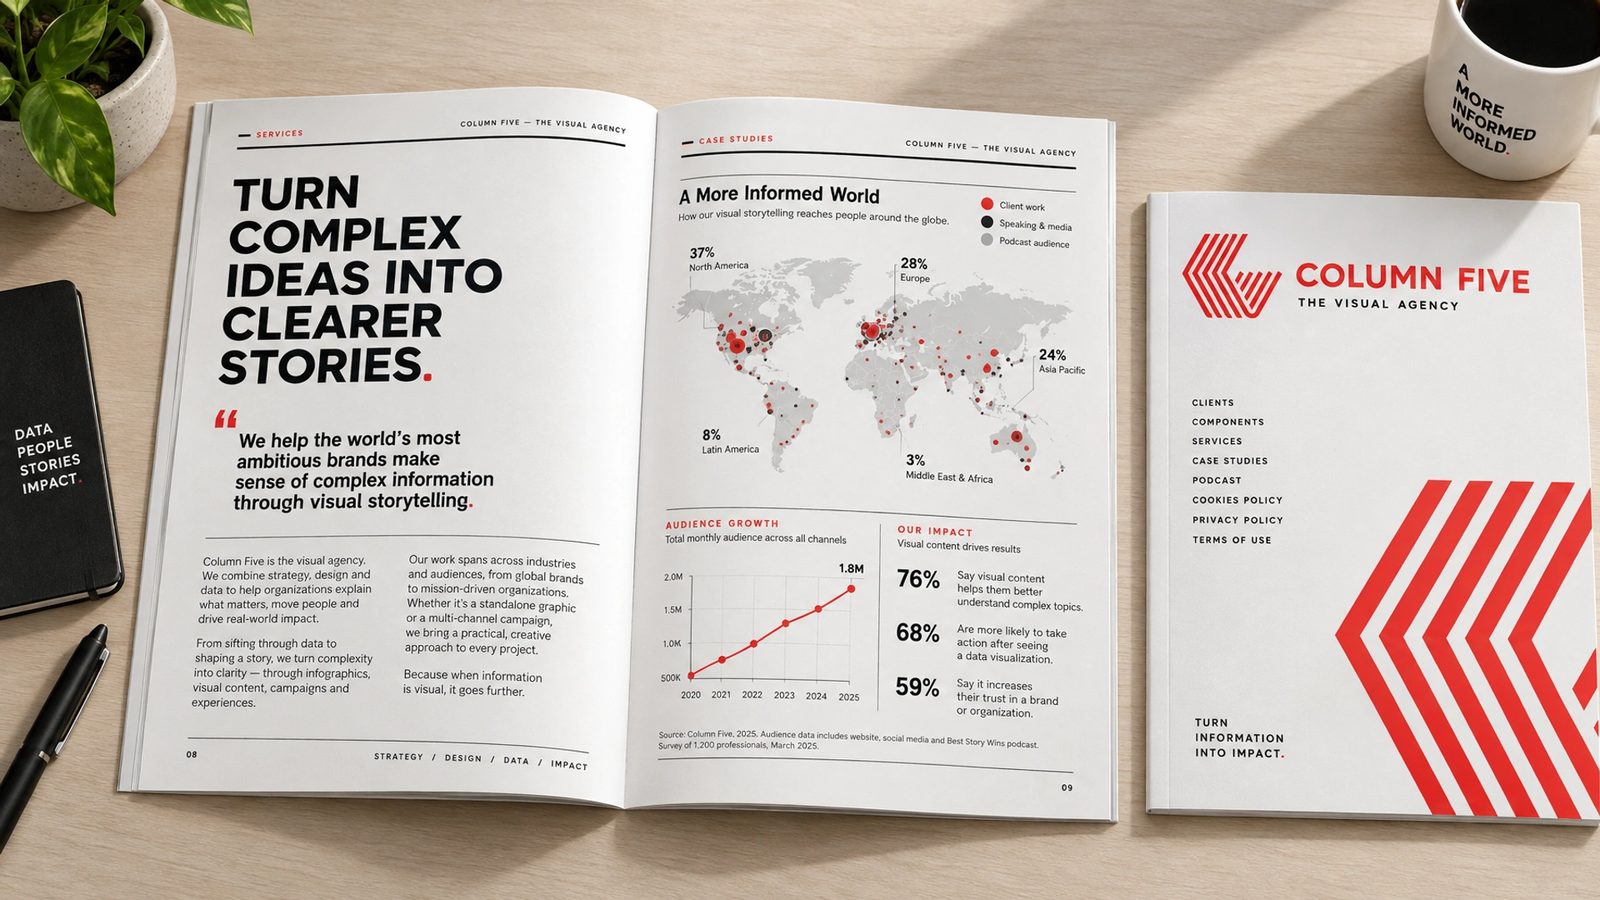
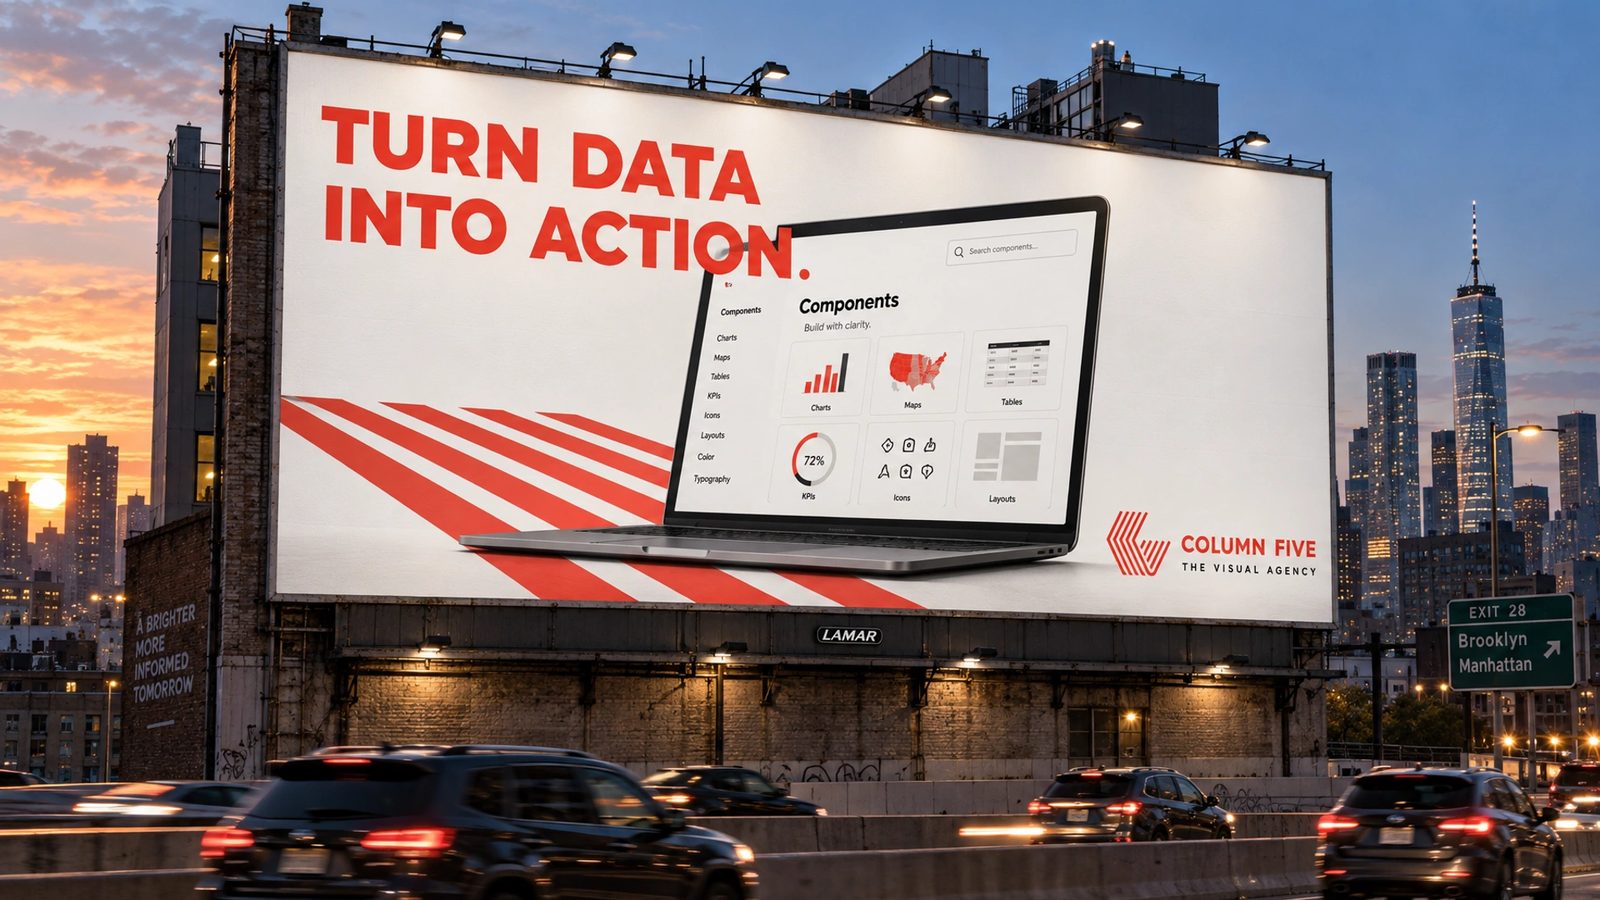
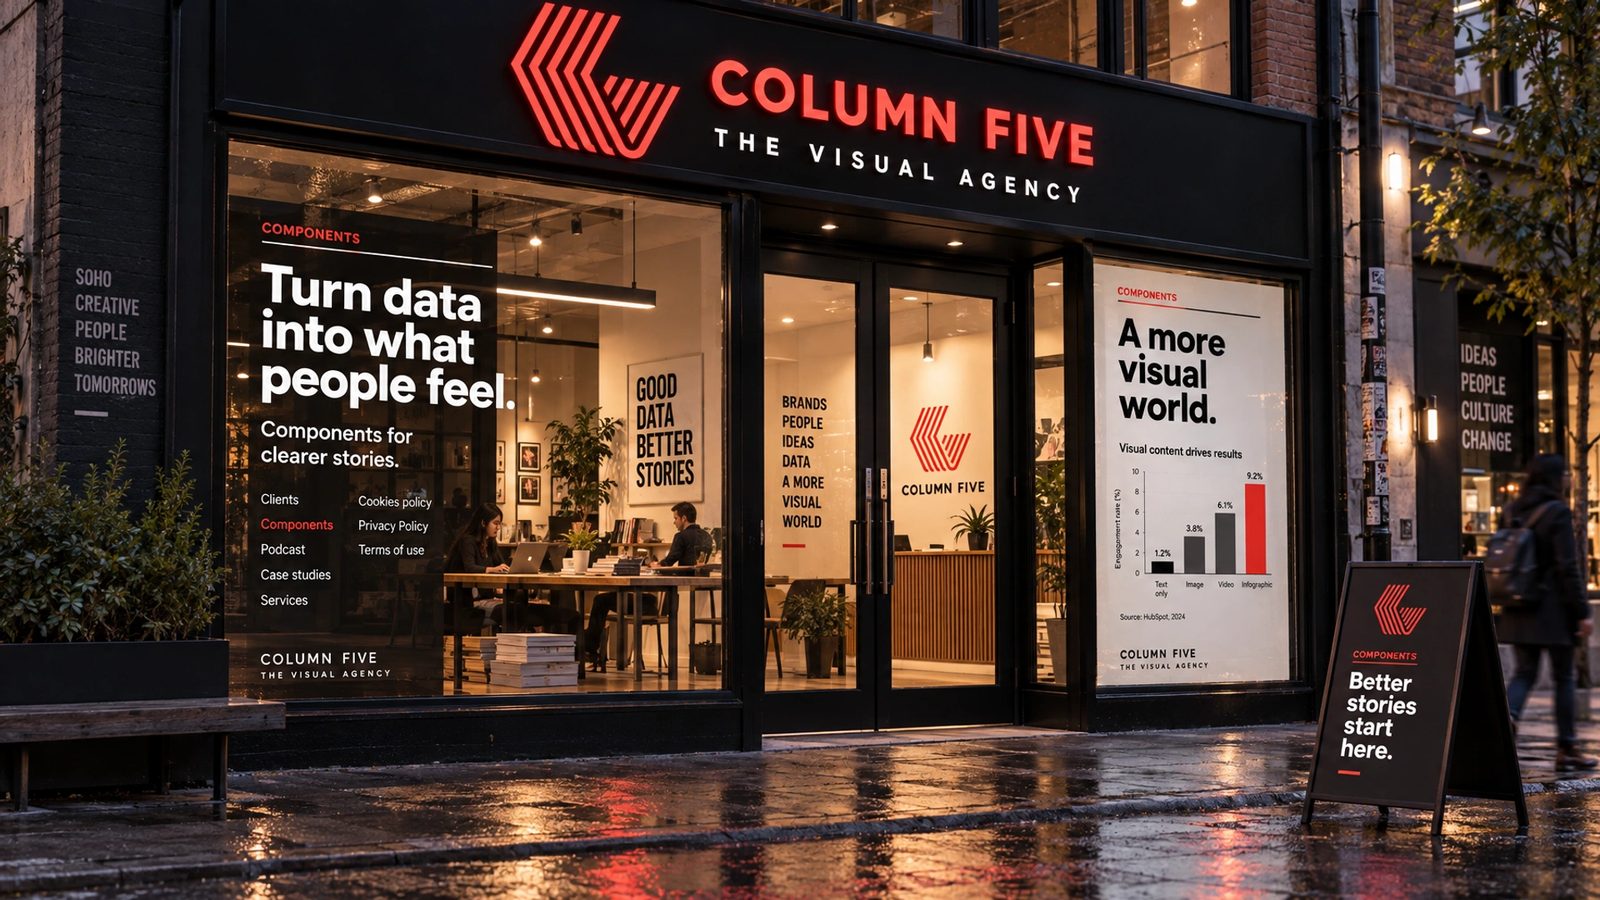
The site and admin are the work. The brand world is a 2026 study made with my own tool from them, not work for Column Five.
We specialize in creating beautiful visuals that tell stories to educate, inform and inspire.
Column Five, 2013
Role
Senior software developer at Column Five, 2013 to 2014. A 2026 study for the brand world.
The site
columnfivemedia.com on Rails and Angular: home, work, capabilities, clients, about, blog and jobs.
The admin
Projects, case studies, assets, clients and site content in one place, with the site’s server and browser metrics on its first screen.
Visage
Lead UI designer and front-end developer on the studio’s real-time data visualisation and reporting platform.
Fifteen surfaces
From the locked brand DNA: logo system, guidelines, cards, stationery, packaging, merch, a data-viz system, web, app, a campaign, an editorial spread, billboard and storefront.
- Front-end engineering
- Rails & Angular
- UI design
- Data visualisation
- Brand DNA extraction
- Brand systems
Next
The agency lives in the archive with the rest of the studio years.
Browse the archive →